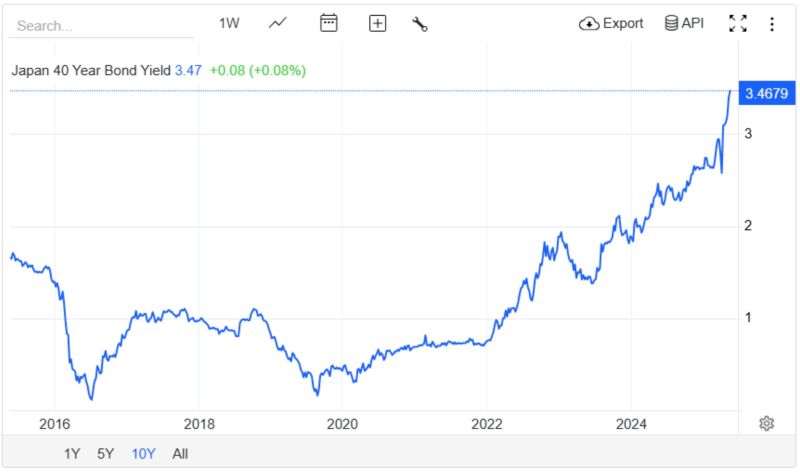
JUST IN 🚨: Japan's 40-year bond yield just jumped to 3.47%, its highest level in 2 decades
Source: Barchart
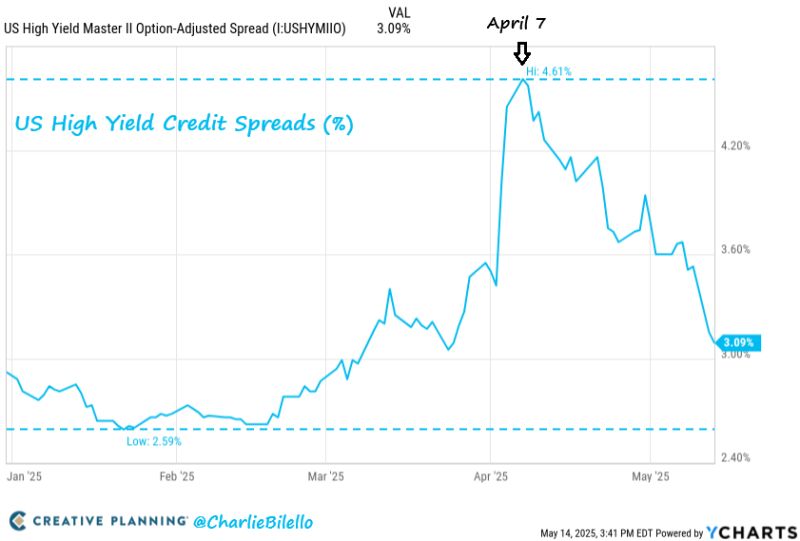
During a huge risk-on advance, US High yield spreads have tightened 152 bps since April 7.
With spreads now at 309 bps above Treasuries, credit market investors are back to pricing in a very optimistic outlook with no recession and few defaults. Source: Charlie Bilello, Y Charts
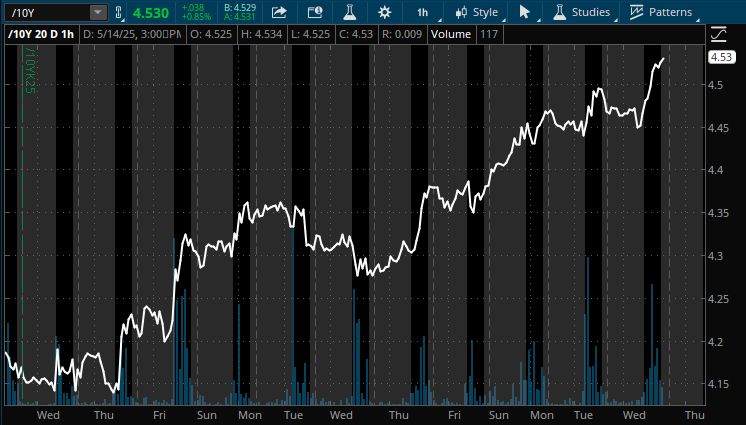
🔴 The US 10-year Treasury bond yield is on the rise.
espite the fact that the economy is slowing down. Despite the fact that inflation surprised on the downside recently. So what's going on? 😨 The US Treasury market is trying to absorb a flood of issuance without its historical buyers. 👉 Foreign official demand is weak. Domestic institutional & retail demand as well. And with the Fed still engaged in Quantitative Tightening. 📢 If this continues, consequences are well known: •Wider mortgage spreads (housing stress), •Lower bond market liquidity (bid-ask gaps widen), •Pressure on long-duration tech and utility stocks (+ the end of risk assets rebound) Note that the rise of US bond yields will not necessarily translate into dollar strength - we might see a similar correlation (stocks + bonds + dollar coming down at the same time) as observed a few weeks ago. Stay tuned Source: EndGame Macro on X
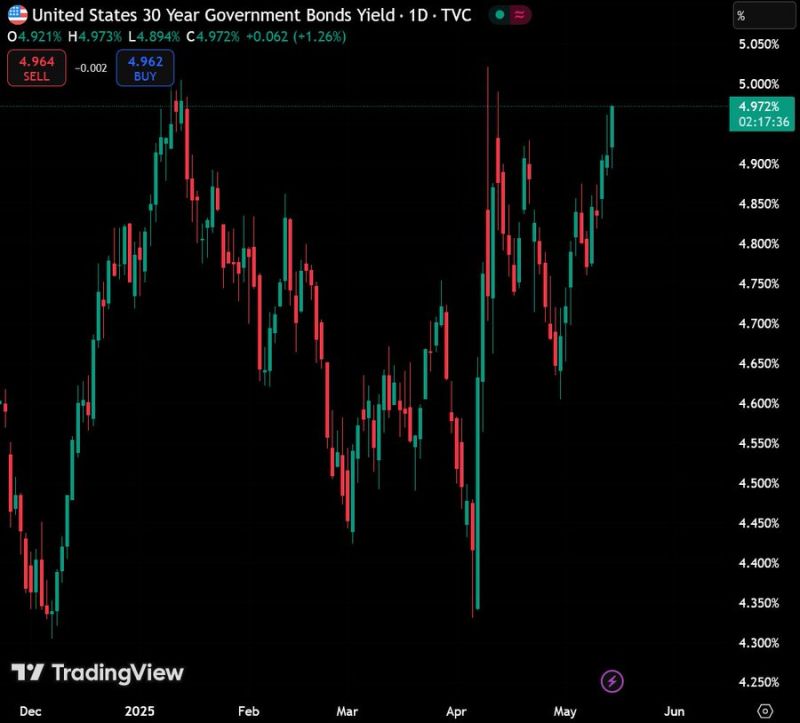
US 30-year Treasury yield is flirting with the 5.0% handle once again...
The last time it was trading at this level, the US administration panicked. The entire world is now watching the world's largest bond market. Source: Global Markets Investor
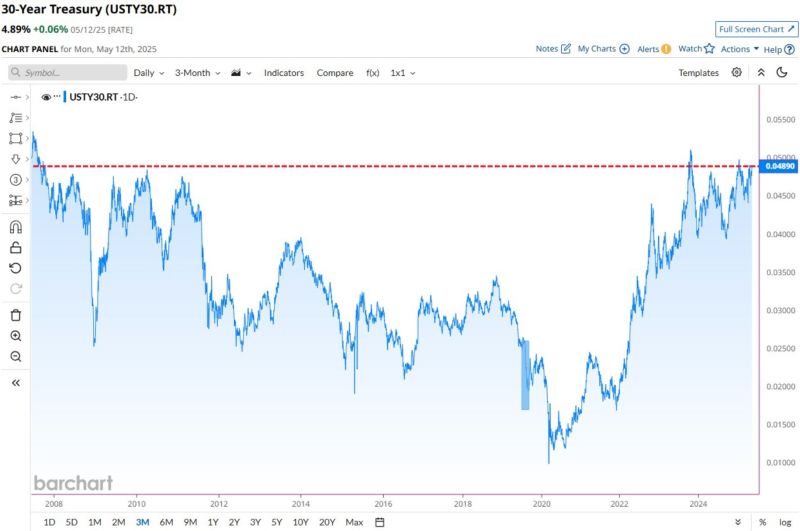
US 30-Year Treasury Yield jumps to 4.89%, sitting near the highest levels of the last 18 years
Will the rise of bond yield start to hurt the equity market's recovery? What is the pain threshold? Source: Barchart
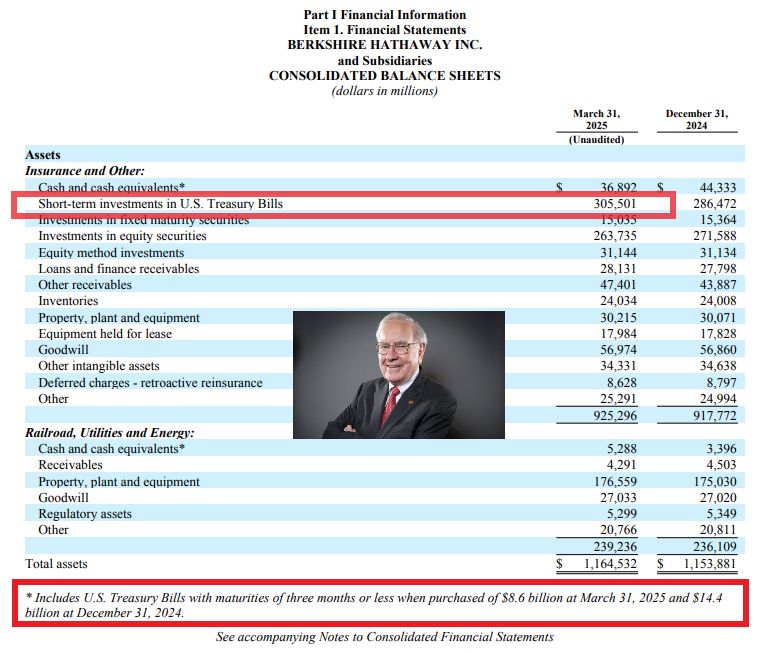
Warren Buffett now owns an astonishing 5.1% of the entire U.S. Treasury Bill Market 🚨🚨🚨
@barchart
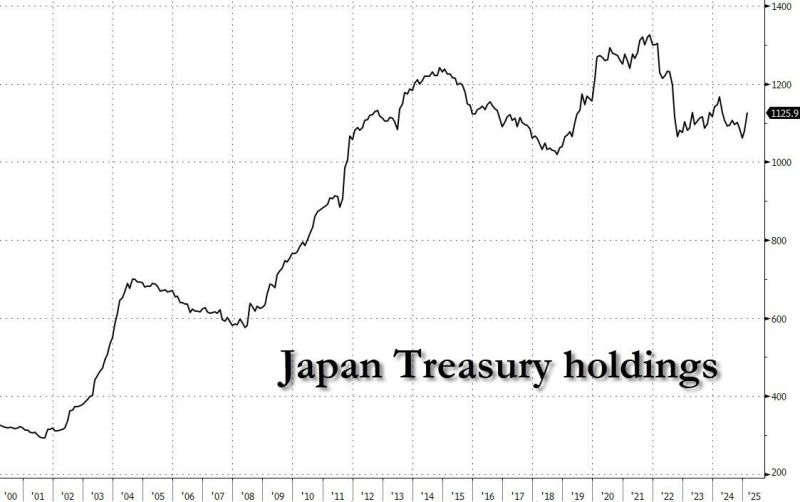
Did Japan's finance minister threaten liquidation of US Treasuries?
Addressing a question on a Tokyo TV program on Friday, Japan Financial Minister Kato said the country's $1.1 trillion in Treasury holdings - the highest of any foreign creditor - could be a "negotiation card" in its trade talks with Washington but "whether or not we use that card is a different decision." In other words, Japan is threatening to sell some/all of its $1.1 trillion in bonds if tariffs are imposed. NLI Research Institute said just minutes after the TV remarks, "Katsunobu Kato’s comments on US Treasuries could be interpreted as dangerously provoking the US government." He added that for the US, unstable long-term rates are a concern, and having Japan continue to hold US Treasuries is beneficial, while maintaining fiscal soundness and the dollar’s status as the reserve currency are important issues that would have positive effects in the medium to long term. Translation: chaos in the US would be painful, but it would be catastrophic for Japan. Source: www.zerohedge.com
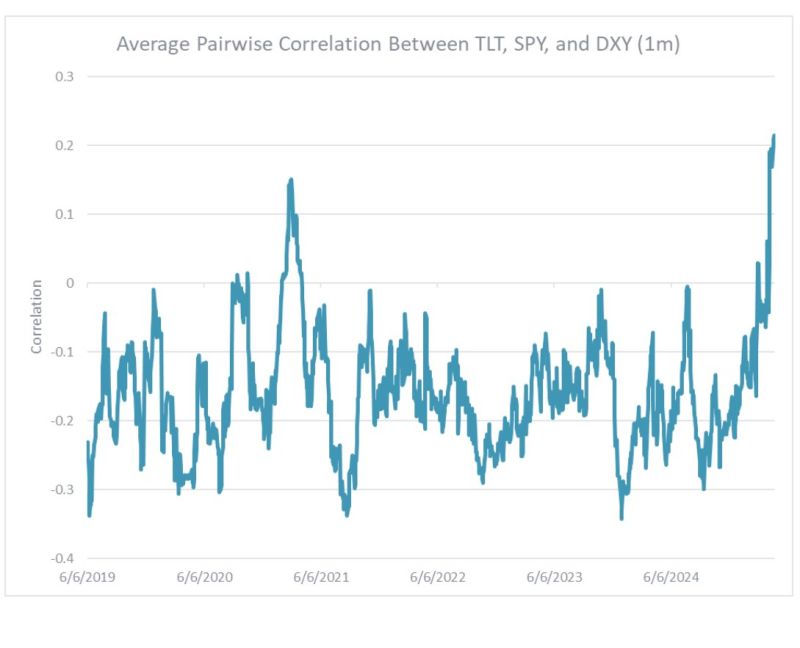
Correlations among US stocks, bonds, dollar are at the highest level since at least 2019 - Piper Sandler
Source: Gunjan Banerji @GunjanJS