Life below zero...
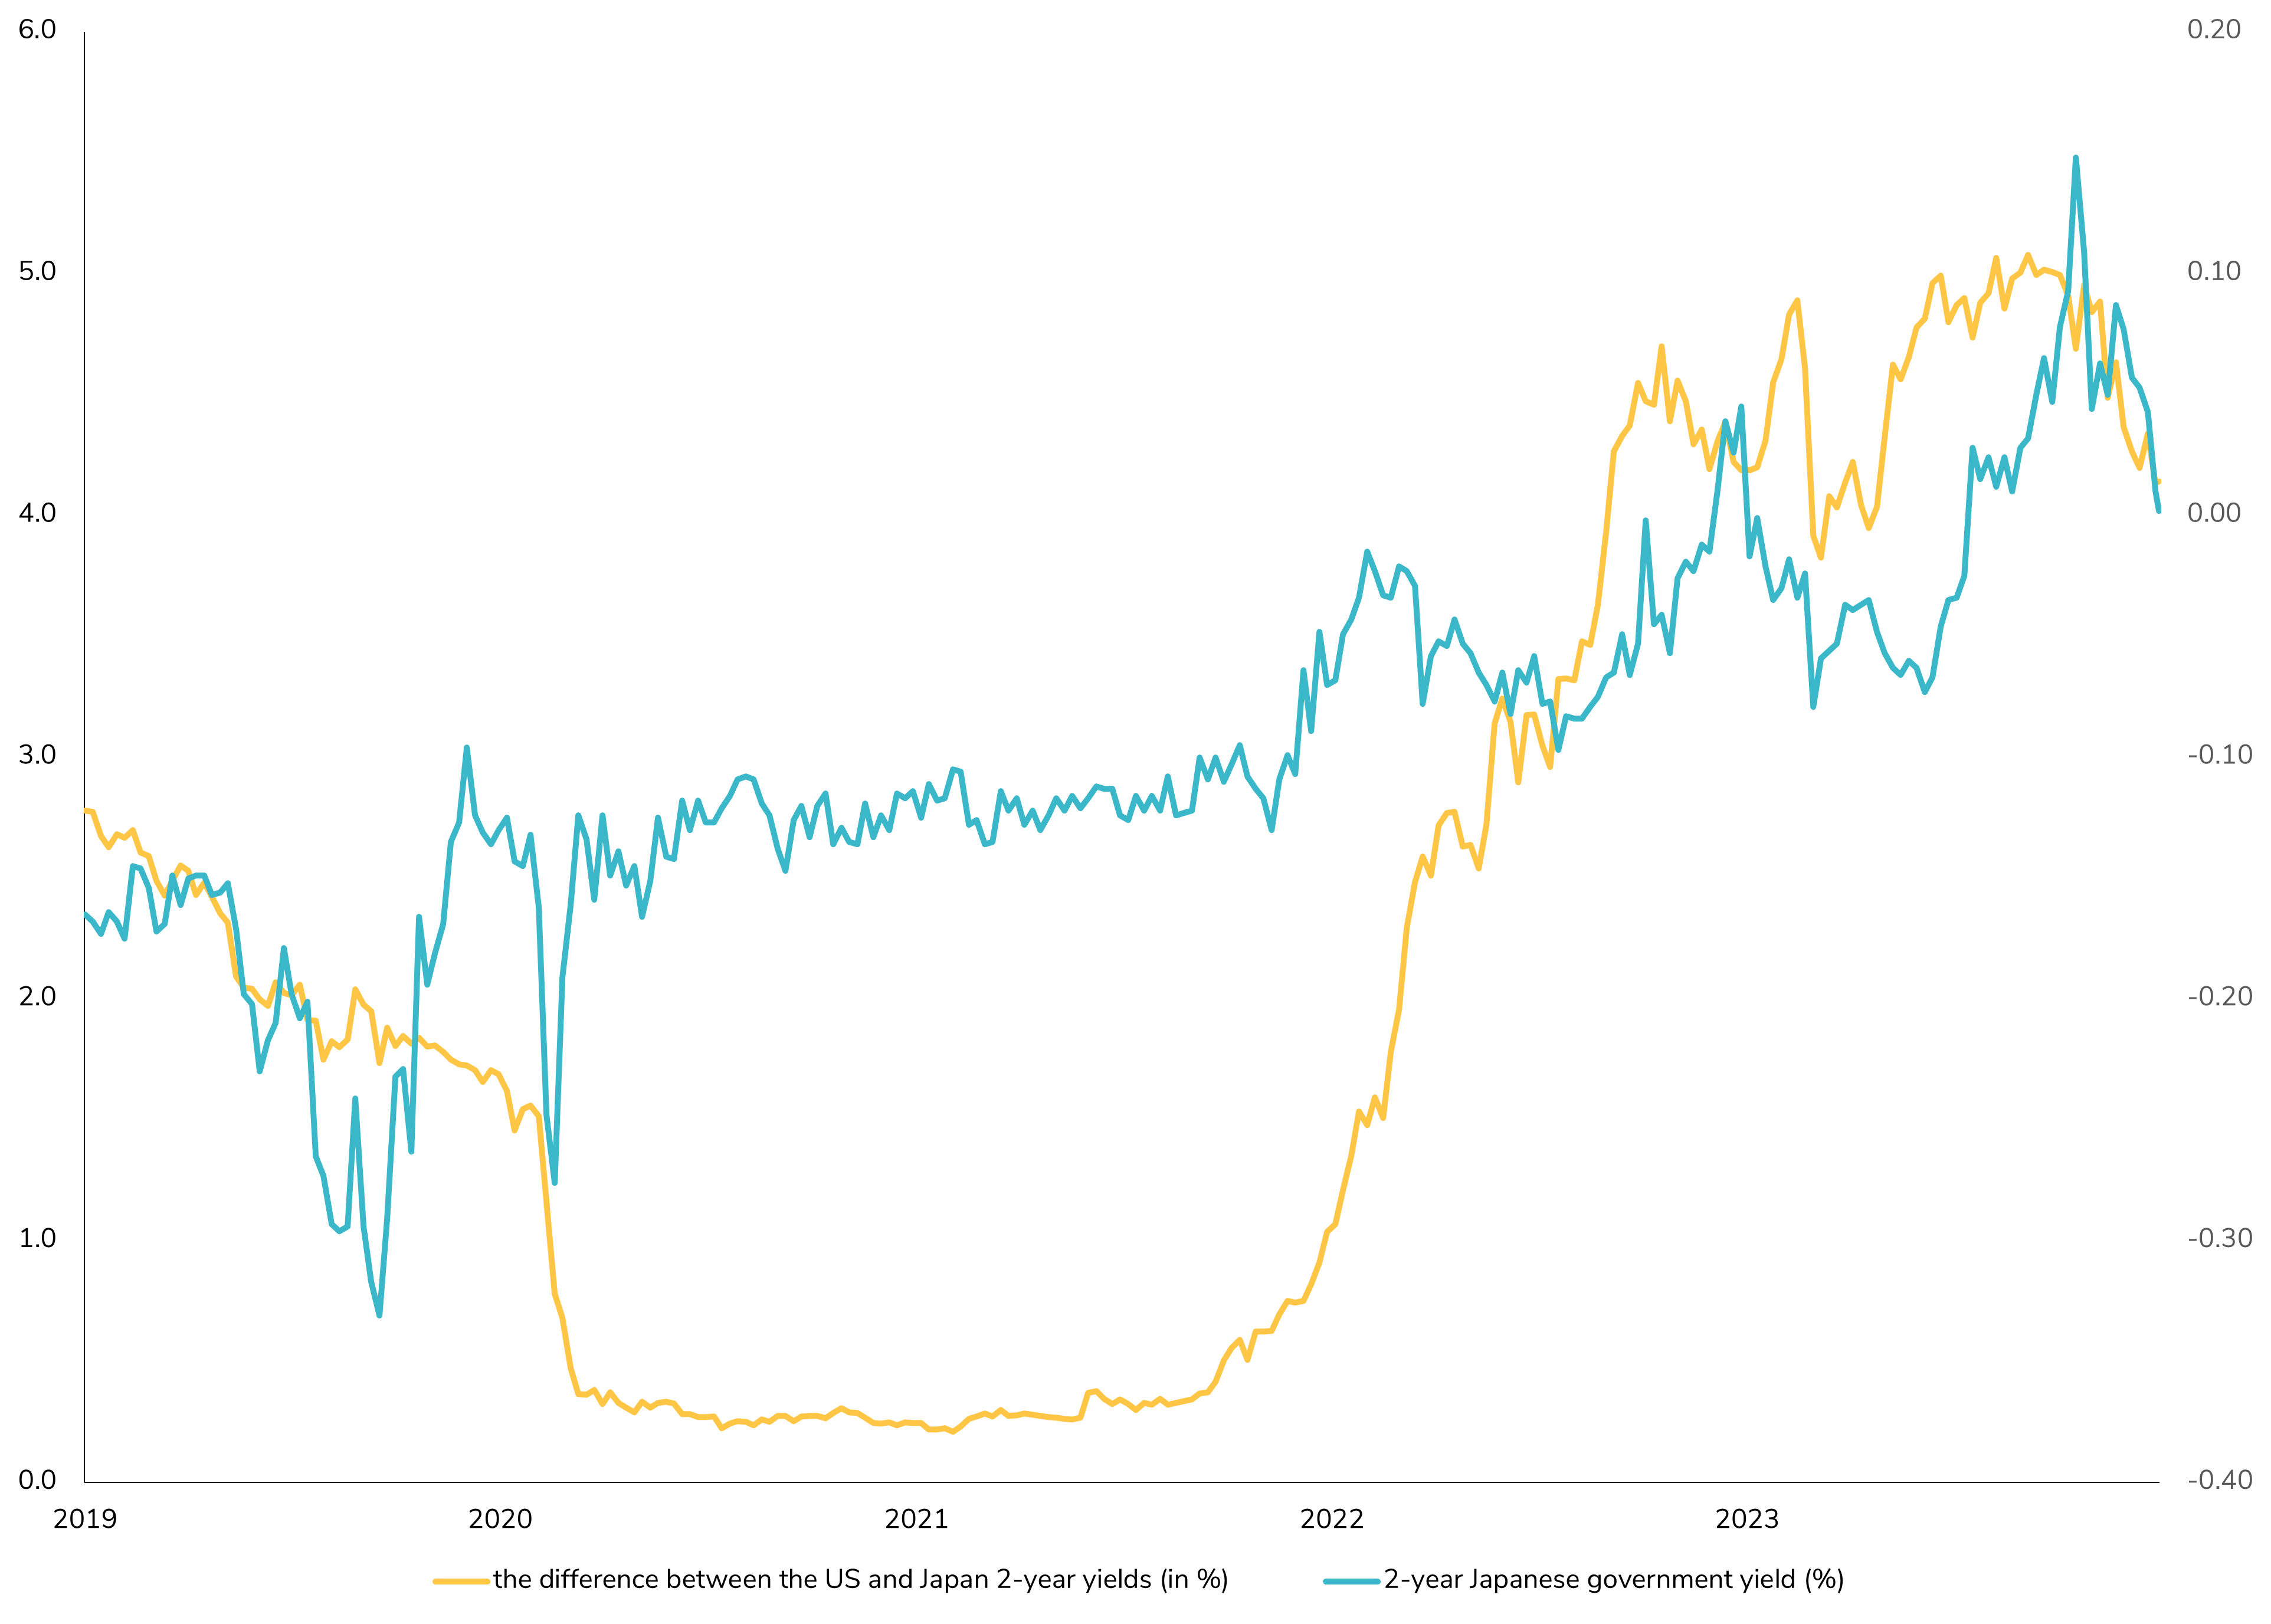
JAPAN 2-YEAR YIELD FALLS BELOW ZERO FOR FIRST TIME SINCE JULY

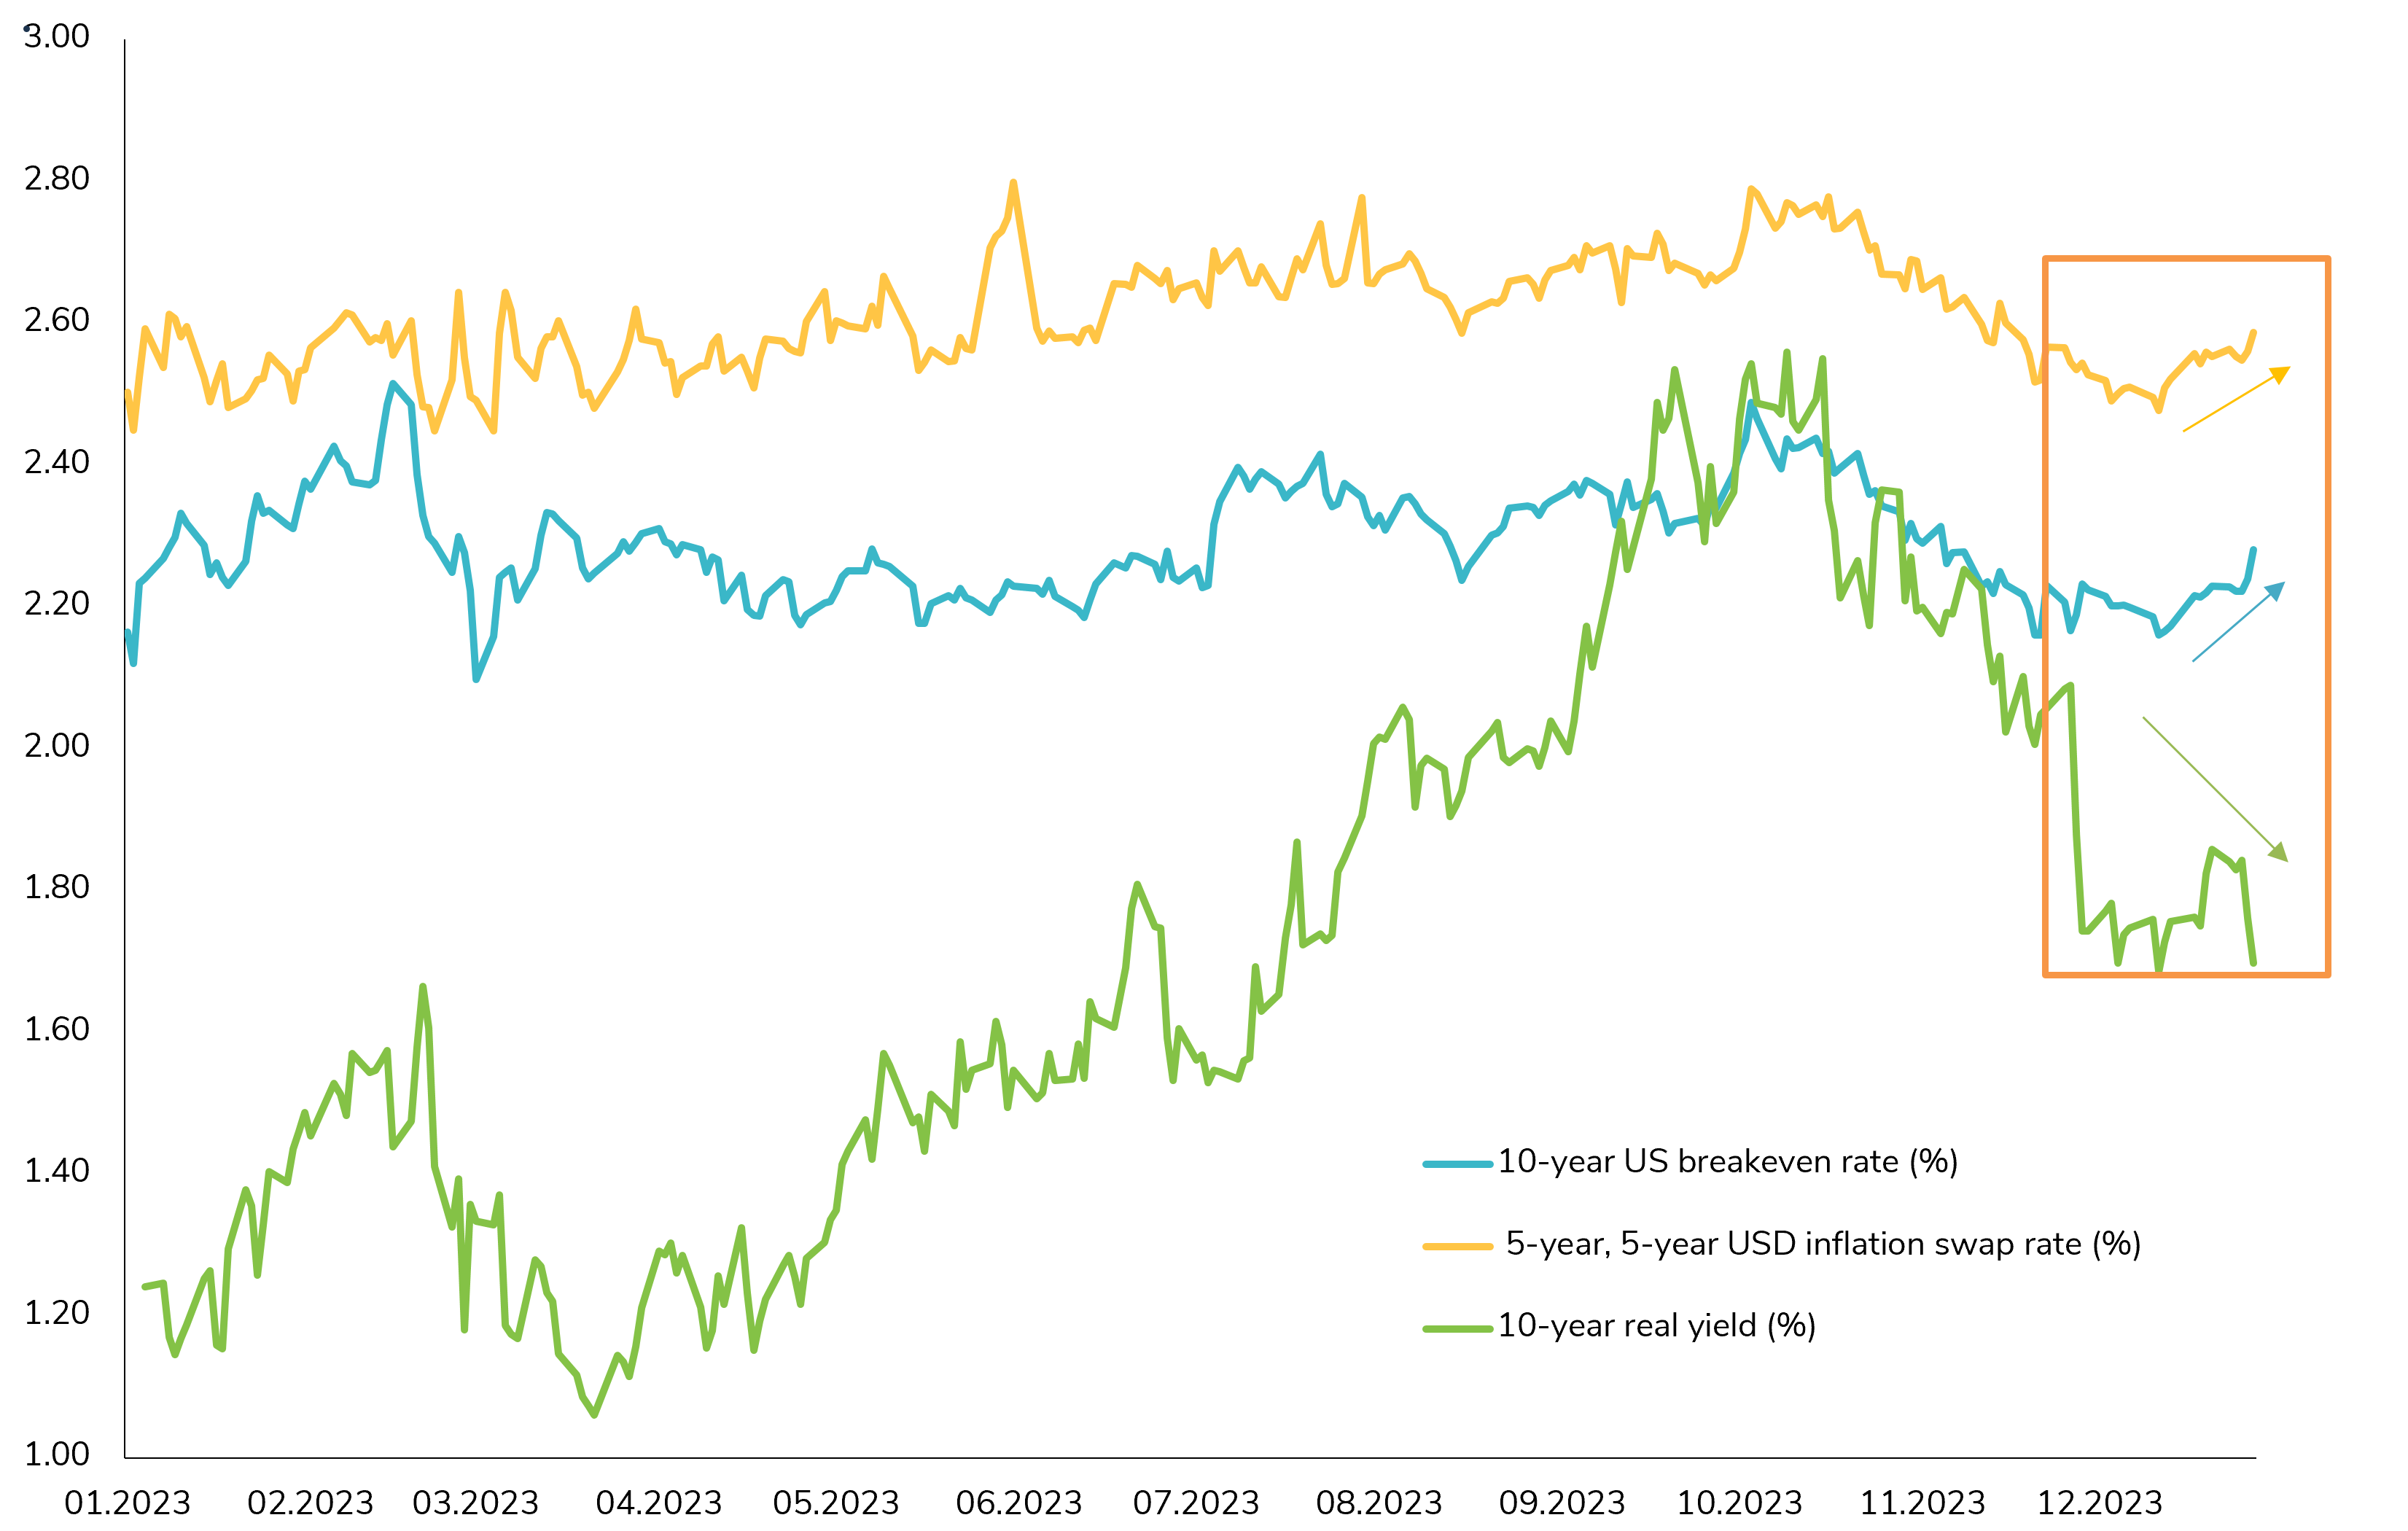
The Dynamic of Rising US Treasury Yields and Inflation Expectations 📈
As we move further into the new year, there's a noteworthy trend unfolding in the world of finance - the steady rise of the 10-year US Treasury nominal yield. However, it's not as straightforward as it may seem. While many have been discussing the prospect of strong disinflation, what's actually exerting pressure on higher rates are the increasing long-term US inflation expectations. You can see this clearly in the chart below, which tracks the 10-year US breakeven (BE) rate and the 5-year, 5-year USD inflation swap rate. Both have climbed by more than 10 basis points, while the US real rate remains lower than at the beginning of the year. So, what is the market pricing in? Is it a reflection of the Federal Reserve's successful navigation toward a soft landing for the US economy? Or is it a response to rate-cut expectations, hinting at the resilience of the US economy? The dynamics at play here are fascinating and open up a world of possibilities. As we continue to monitor these developments, it's clear that 2024 holds some intriguing questions for investors. Source: Bloomberg
The 2-Year Japanese Yield Back in Negative Territory 📉
While the anticipation has been building for the Bank of Japan (BoJ) to exit its negative rate monetary policy in April 2024, the market seems to be taking a different turn. Today, the 2-year Japanese bond yield closed in negative territory. The BoJ has signaled its readiness to end the negative interest rate policy, but it's contingent on economic data and the outcomes of the March wage talks. Japan's path to normalization will be unique, as its economy still requires some level of monetary easing. The BoJ's terminal rate is projected to gradually reach around 0.5% over three to four years, potentially beginning with one or two rate hikes in the first year. However, the timeline for the BoJ to abandon its negative interest rate policy is now being seen as possibly extending further into 2024. Governor Kazuo Ueda's cautious statements, combined with unforeseen challenges like the recent earthquake, have led many economists to reconsider their forecasts, shifting expectations from January to potentially April or later. Stay tuned for more updates on this evolving situation. The Japanese monetary policy landscape is certainly one to watch closely in the coming months. Source: Bloomberg.
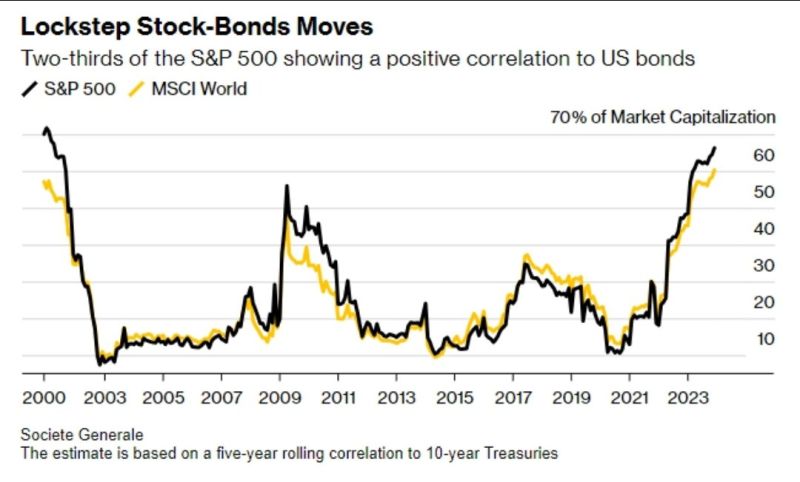
60% of S&P 500 stocks are showing a positive correlation with U.S. Bonds. Most since 2001.
Source: Win Smart, SG, Bloomberg
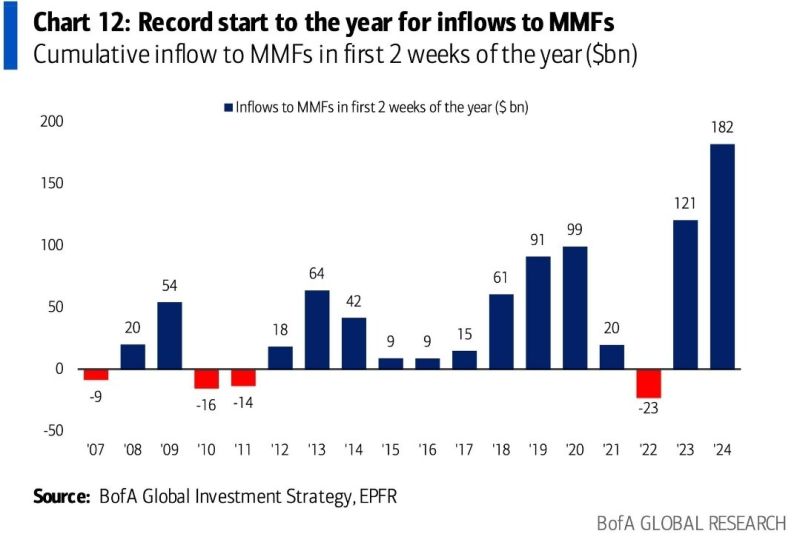
Fund flows do not sound "risk-on" at all...
Money Market Funds have seen inflows of $163 billion over the first 2 weeks this year, the highest amount EVER 👇 Source: BofA, Win Smart
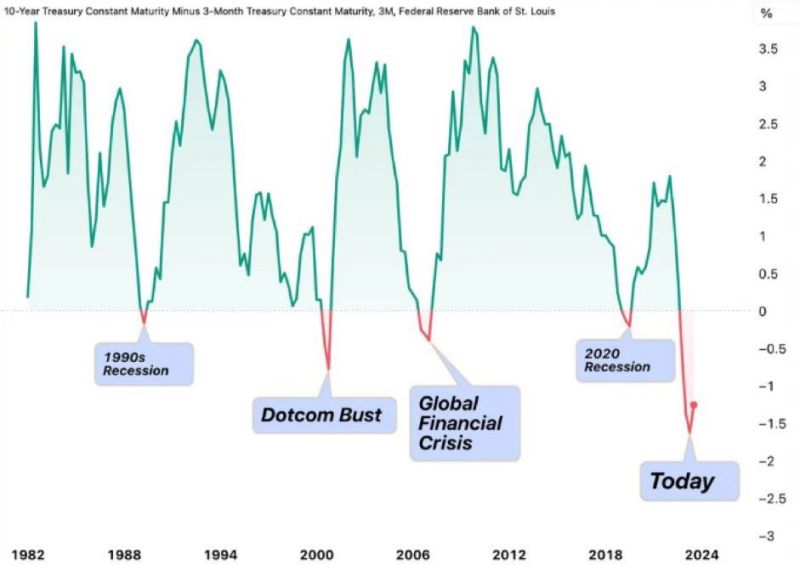
The last 4 times the 10Y Minus 3M Treasury Yield Curve inverted, it led to the 1990s recession, the Dotcom Bust, the Global Financial Crisis, and the 2020 Recession.
Will this time be different? 🤔 Source: Barchart
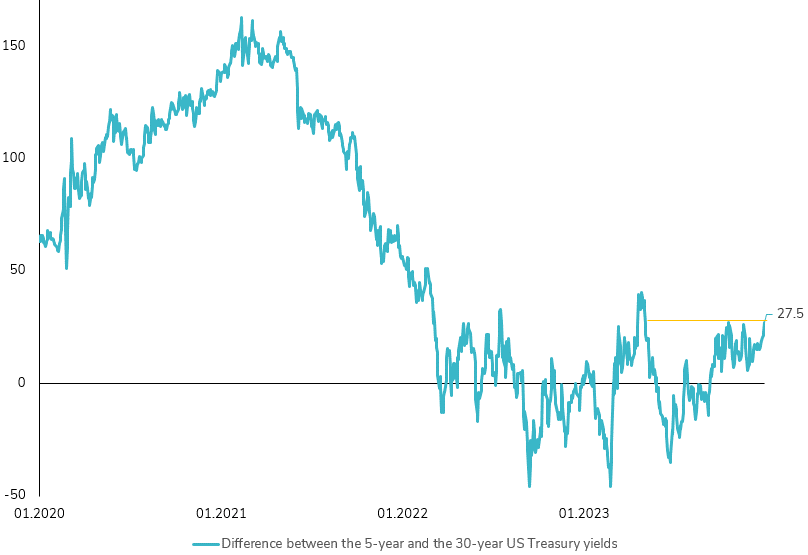
US Treasury Yield Curve Faces Crucial Test Today
Today, the US Treasury market faces a crucial test. Since its low in early December 2023, the spread between the 5-year and 30-year US Treasury yields has surged by 20bps, now touching the highs seen in June 2023. This significant shift sets the stage for today's key event: a $21 billion auction of 30-year US Treasury bonds. 🔍 Notably, the absence of 30-year bond maturities this month suggests that demand will likely stem from investors looking to lengthen their portfolio's duration. This development comes at a time when concerns were already mounting about the long end of the US Treasury yield curve, driven by factors such as negative US term premiums, a heavy supply forecast for Q1, and a resilient US economy that had witnessed a strong rally at the end of 2023. 🏦 This evening's auction is more than just a routine procedure; it's a litmus test for the supply-demand dynamics in the Treasury market. The results will be telling, offering vital insights into market sentiment and future directions, particularly regarding long-term government debt. Keep an eye out for our analysis on the outcome and implications of this pivotal financial event. #Finance #USTreasury #EconomicIndicators"
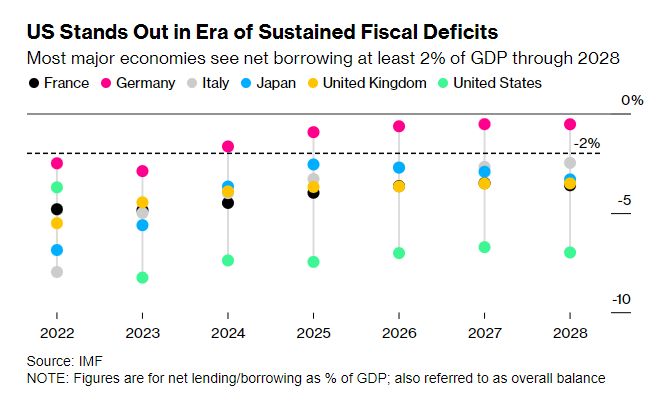
Over the next several weeks, governments from the US, UK and the eurozone will start flooding the market with bonds at a clip rarely seen before
Saddled with the kind of bloated deficits that were once unthinkable, these countries — along with Japan — will sell a net $2.1 trillion of new bonds to finance their 2024 spending plans, a 7% increase from last year, according to estimates from Bloomberg Intelligence.