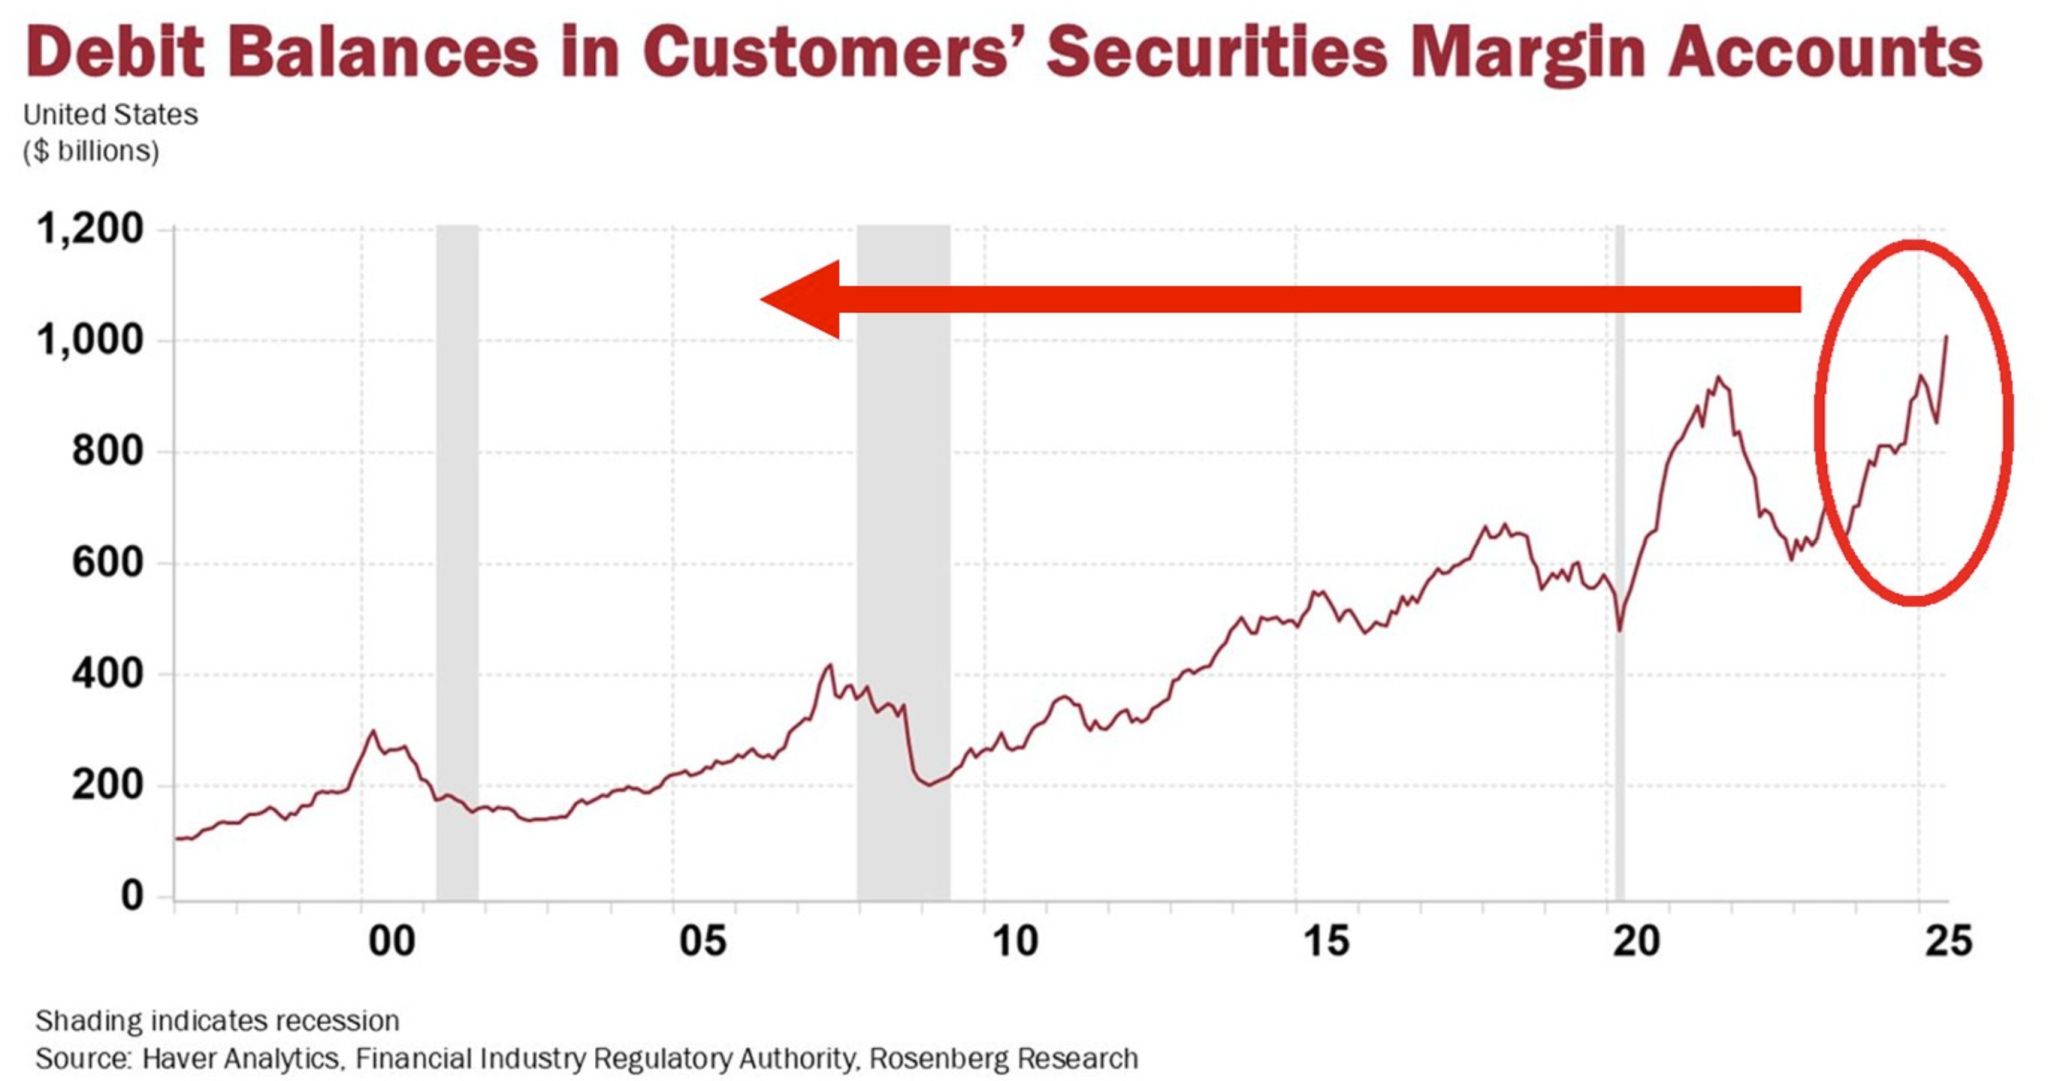
US margin debt has hit $1 trillion for the first time in history.
This is a ~65% surge over the last 3 years. Source: Global Markets Investors
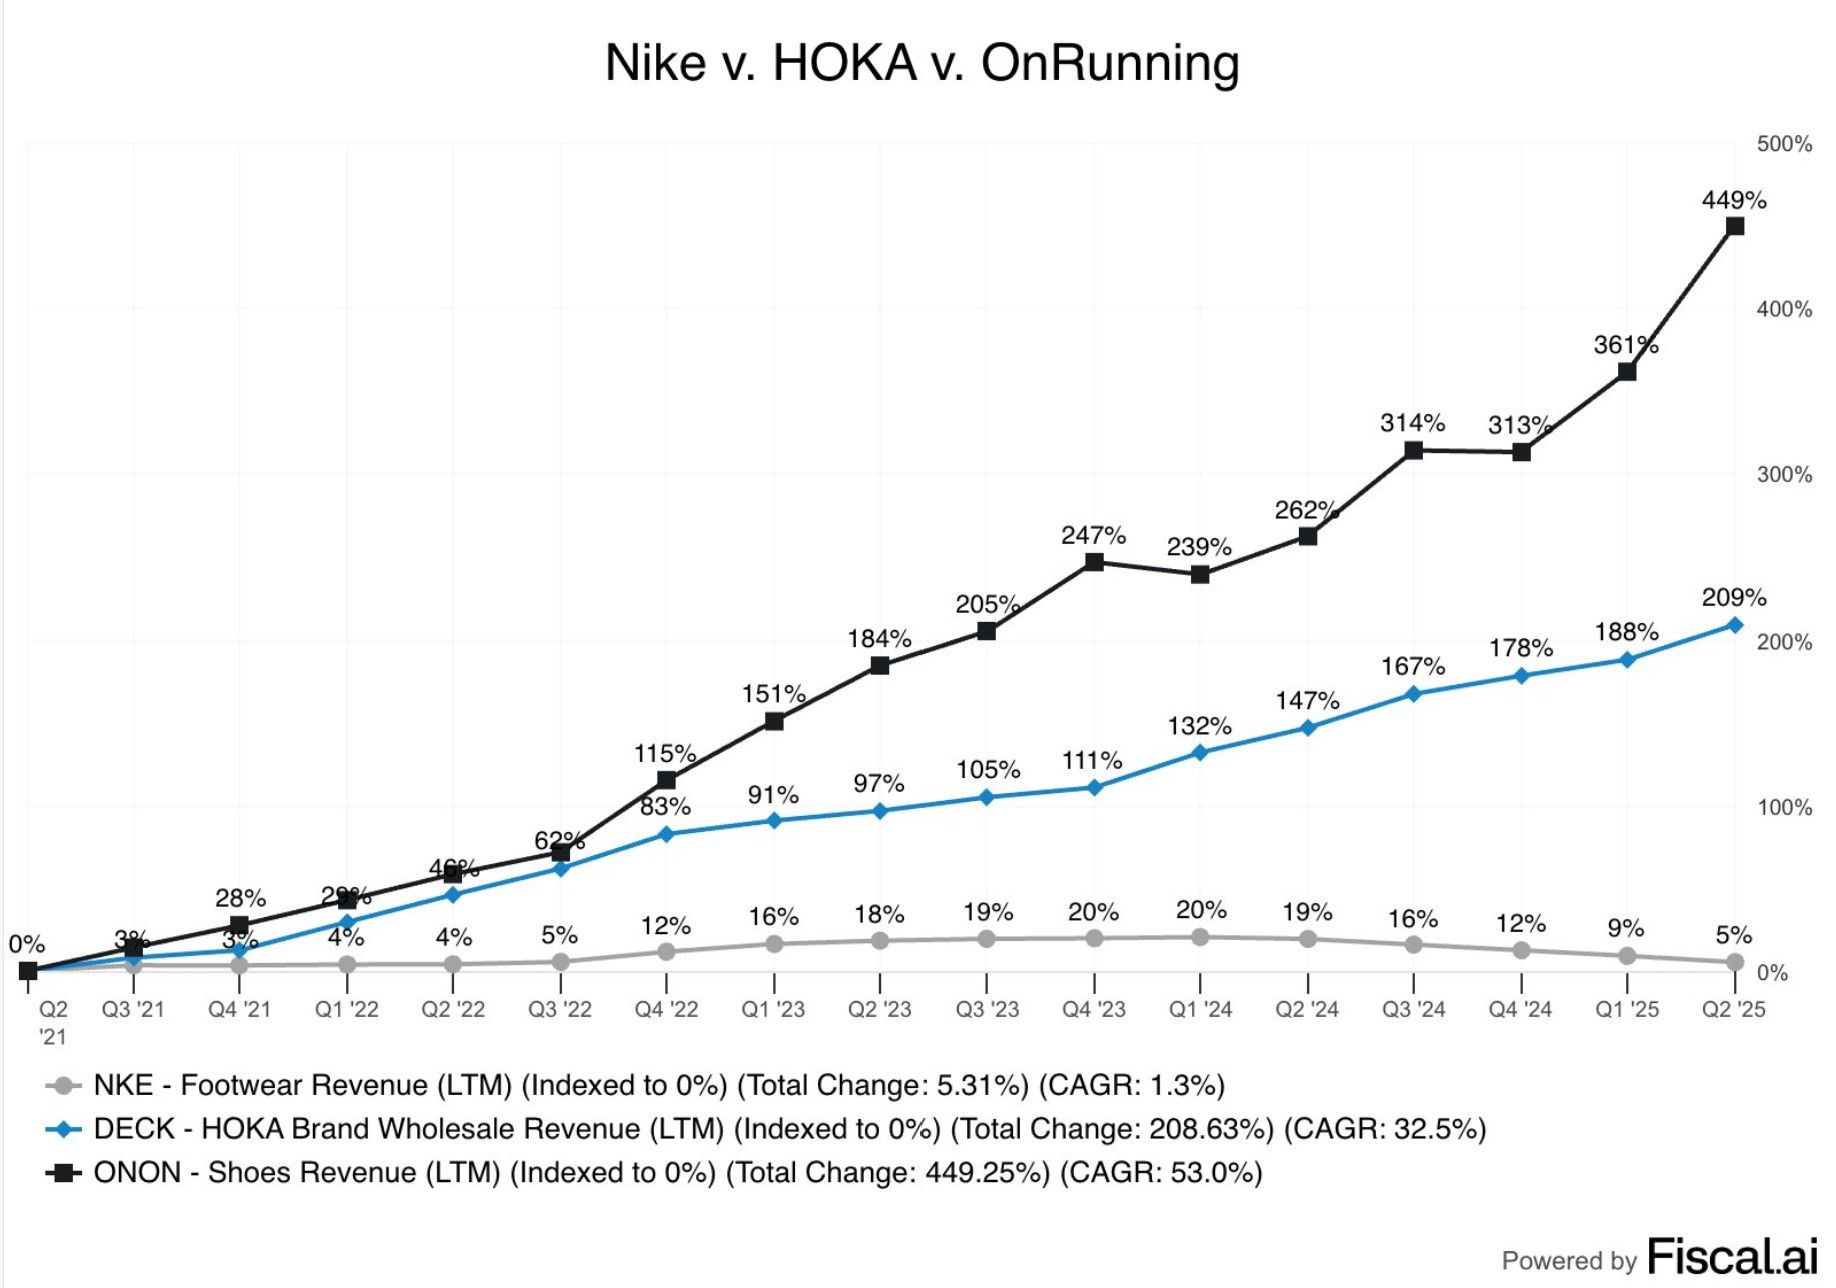
On running and Hoka continue to take market share in footwear space.
On running +449% Hoka: +209% Nike Footwear: +5% Source: fiscal.ai
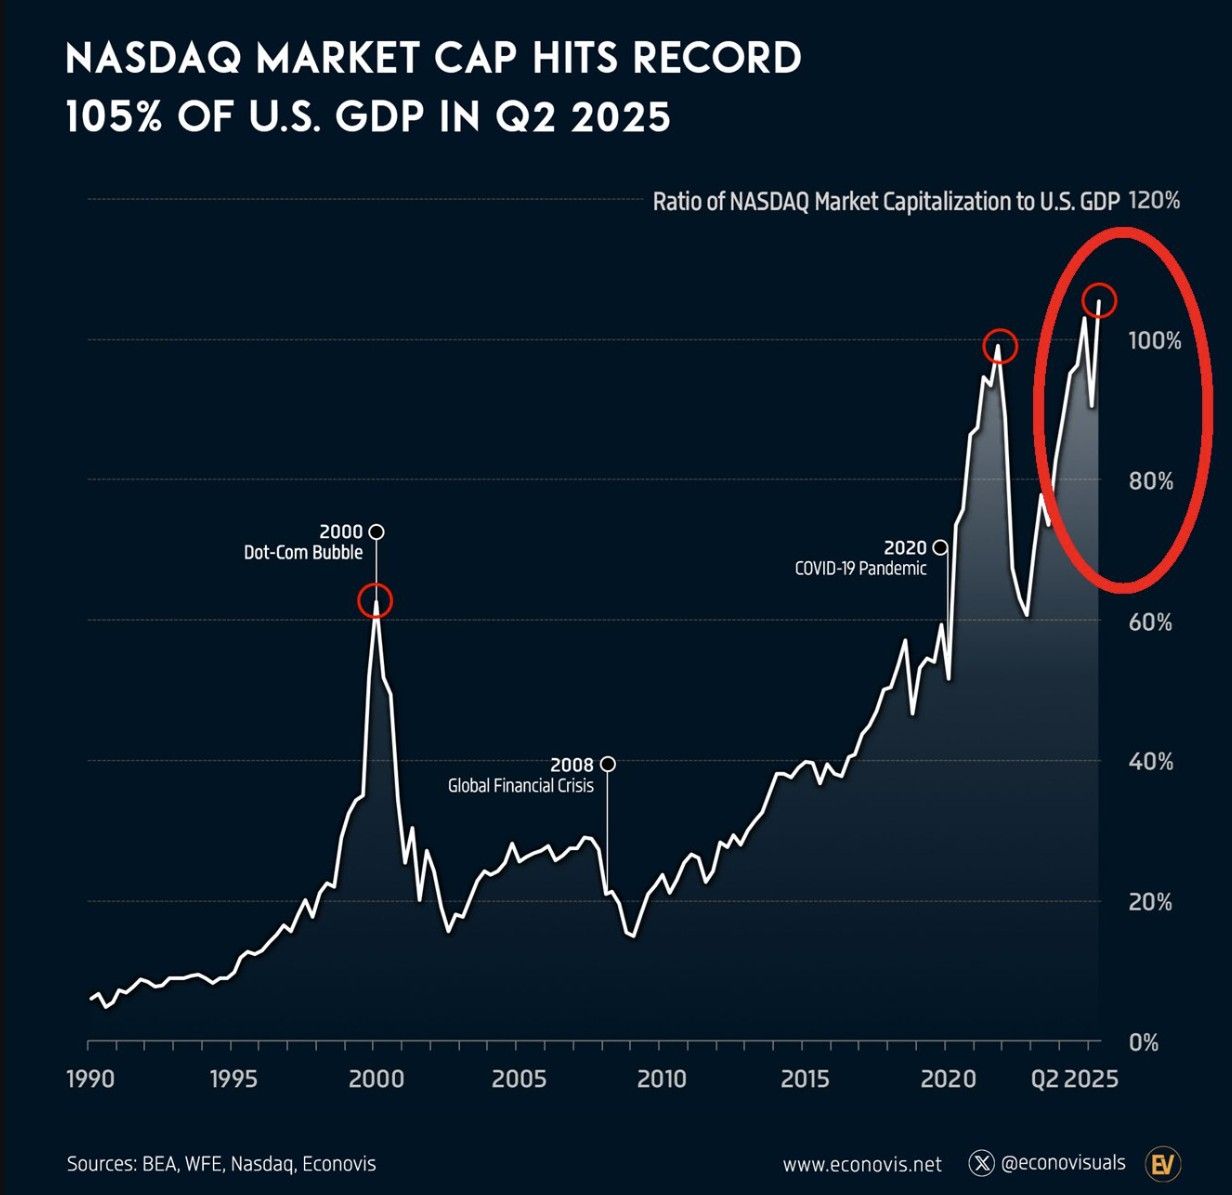
⚠️This has never happened before: The NASDAQ market cap relative to US GDP hit 105%, an all-time high.
The ratio has nearly doubled since the 2022 bear market low and is now ~40 percentage points above the 2000 Dot-Com Bubble. It is also at a record relative to world GDP. Source: Global Markets Investor, econovisuals
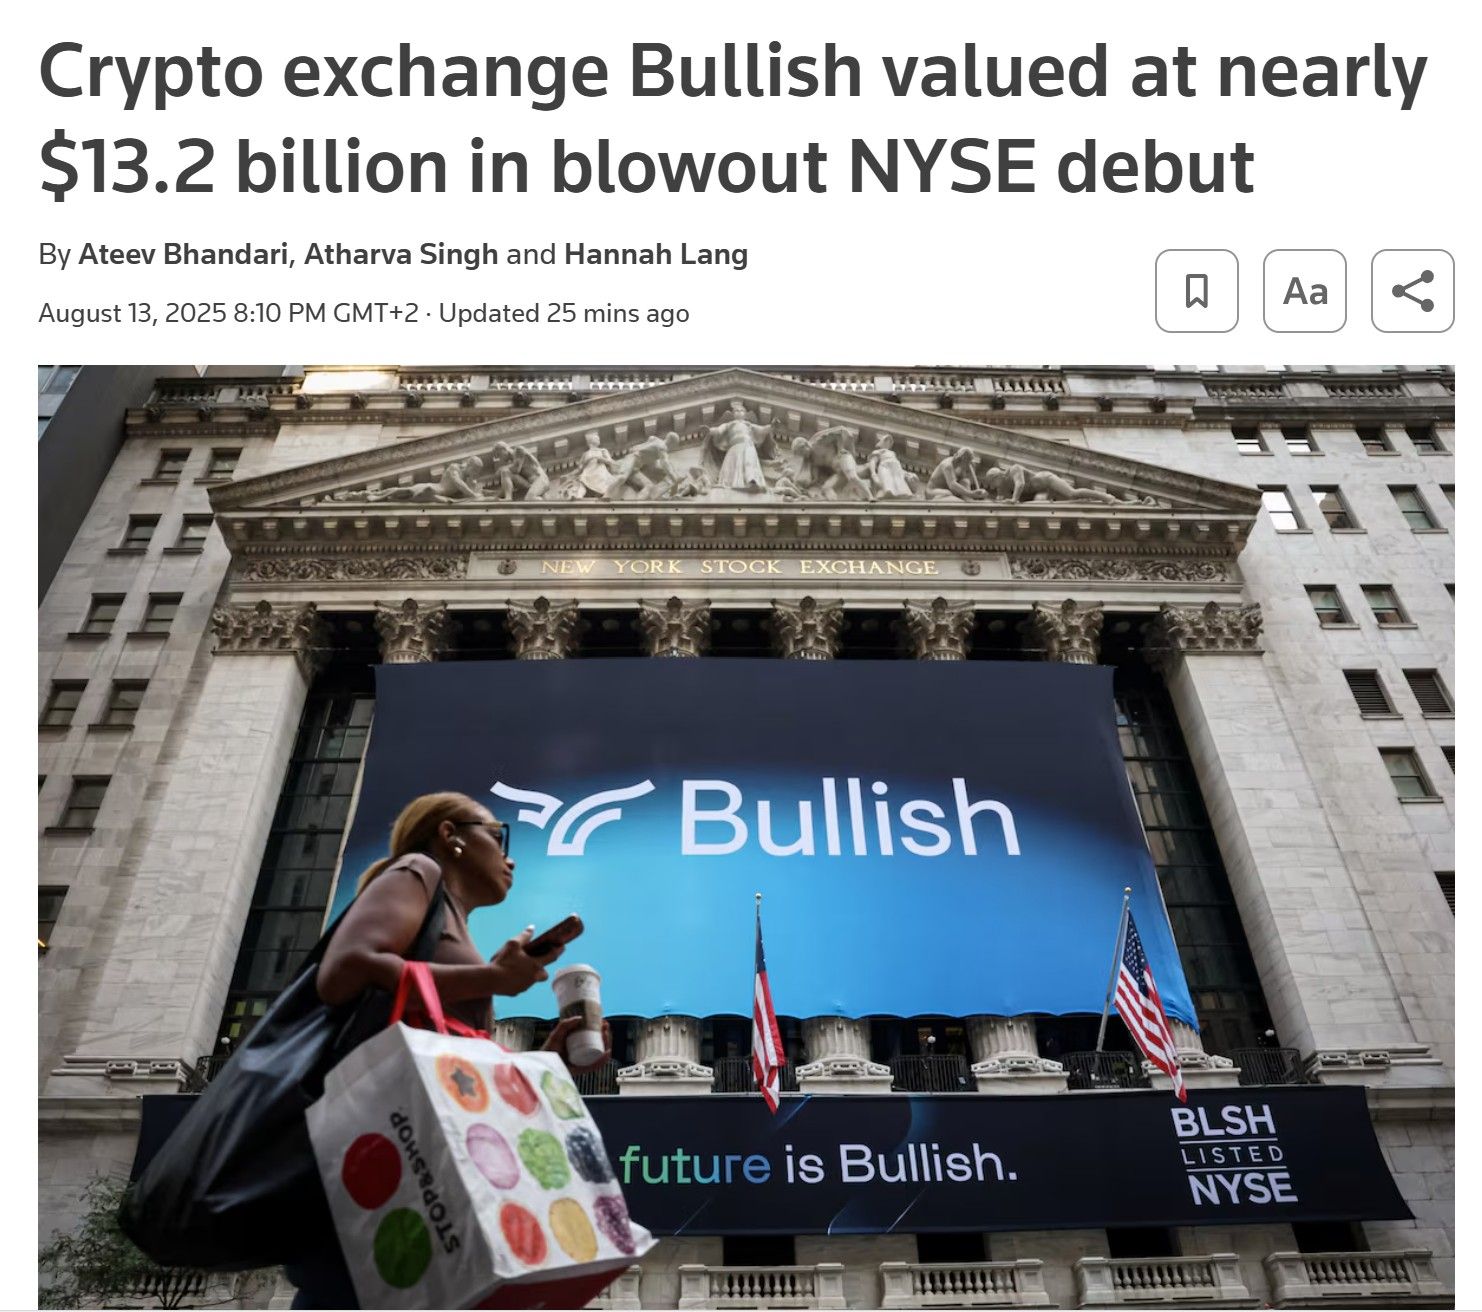
Bullish $BLSH shares open trading at $90 above the $37 IPO price
Cryptocurrency exchange operator Bullish (BLSH.N), opens new tab was valued at about $13.16 billion after its shares more than doubled in their NYSE debut on Wednesday, underscoring investor confidence in the sector and lifting prospects for future U.S. listings by other digital asset firms. The parent of crypto news website CoinDesk raised $1.11 billion in its IPO, valuing the company at $5.4 billion — another sign of mainstream adoption in a market that recently topped $4 trillion. Source: Reuters
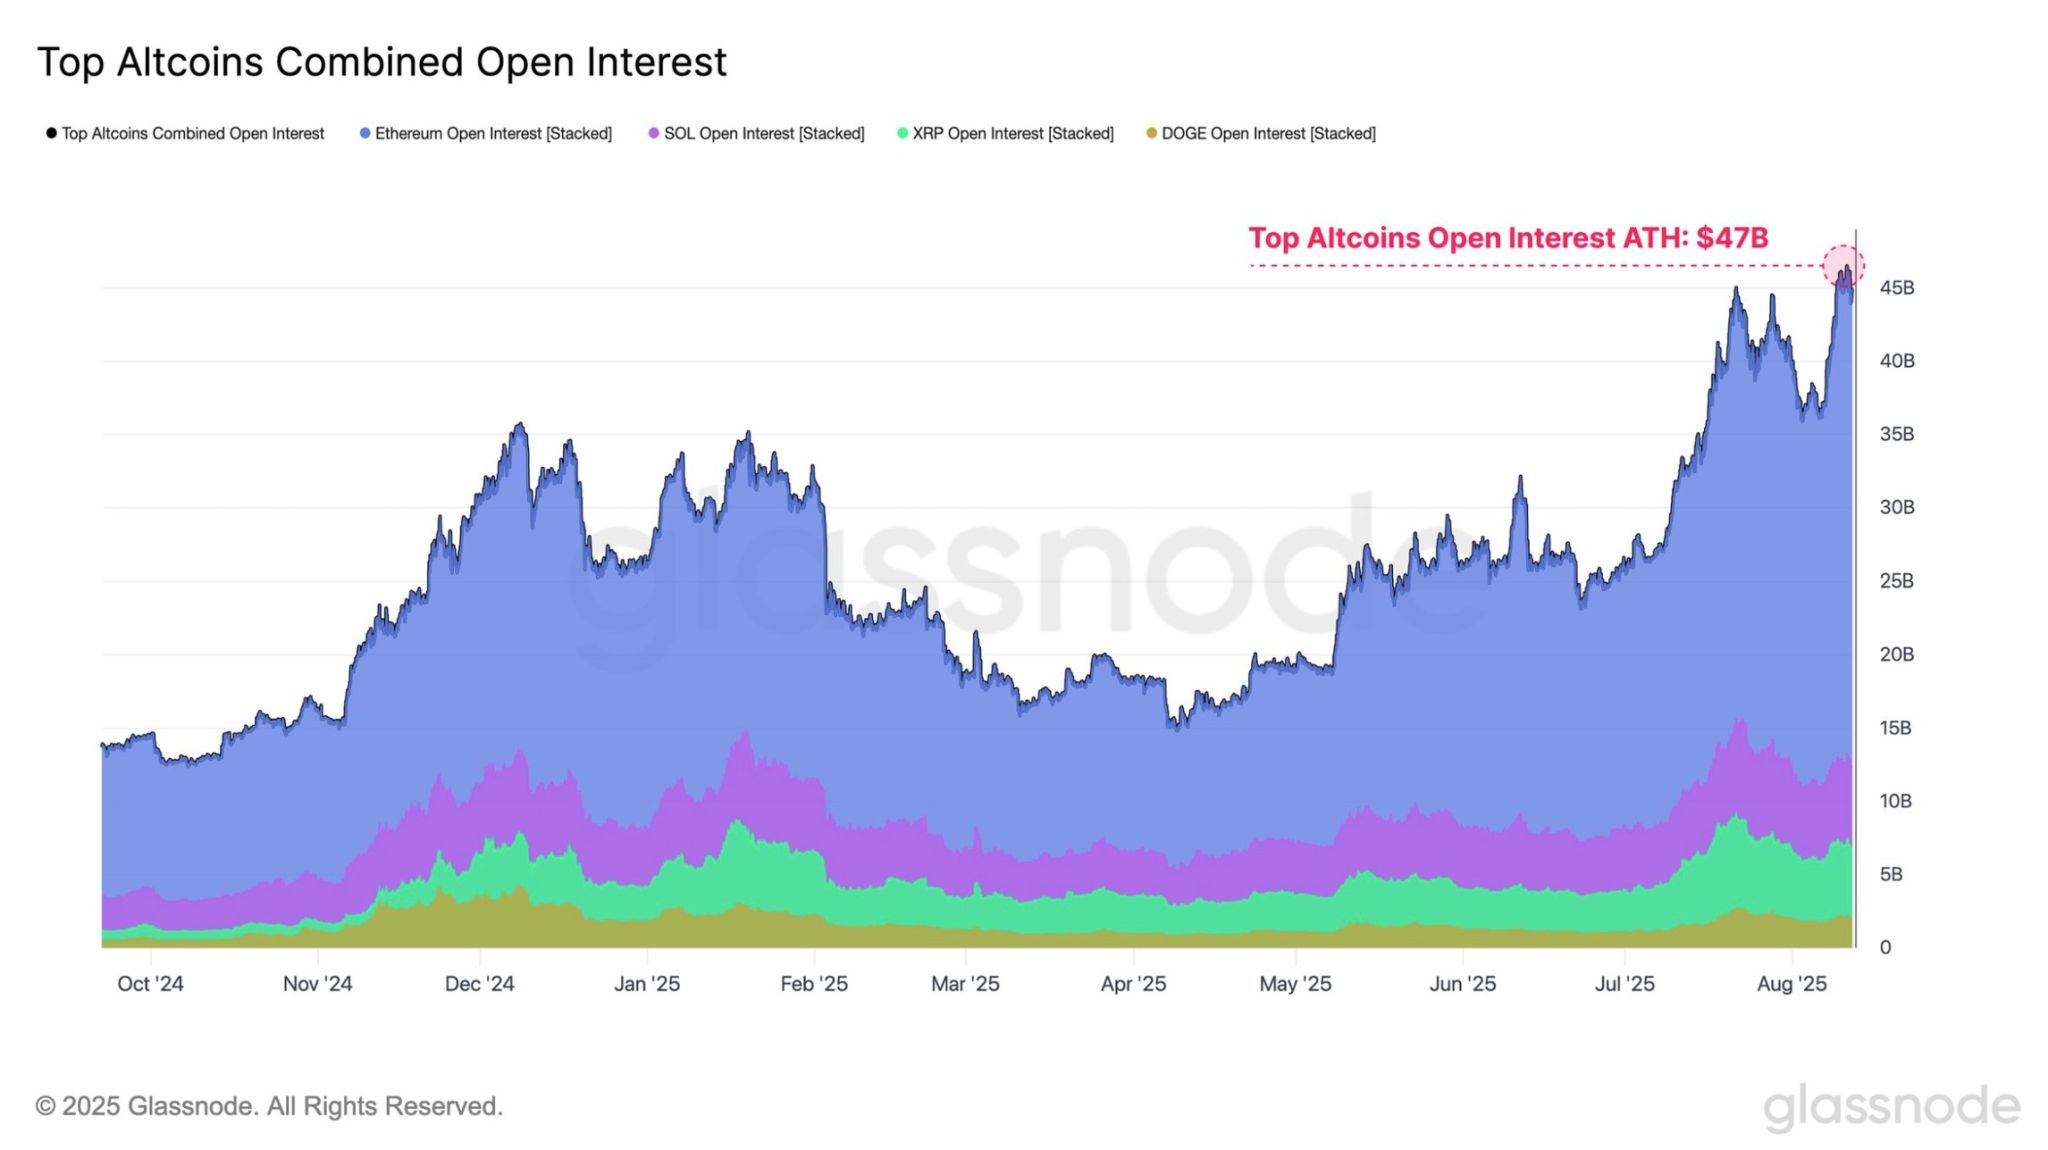
Glassnode: Open interest across major altcoins has surged to an all-time high of $47B.
This concentration of leverage elevates reflexivity, amplifying both upside and downside price reactions and increasing fragility in market structure. Source: Glassnode
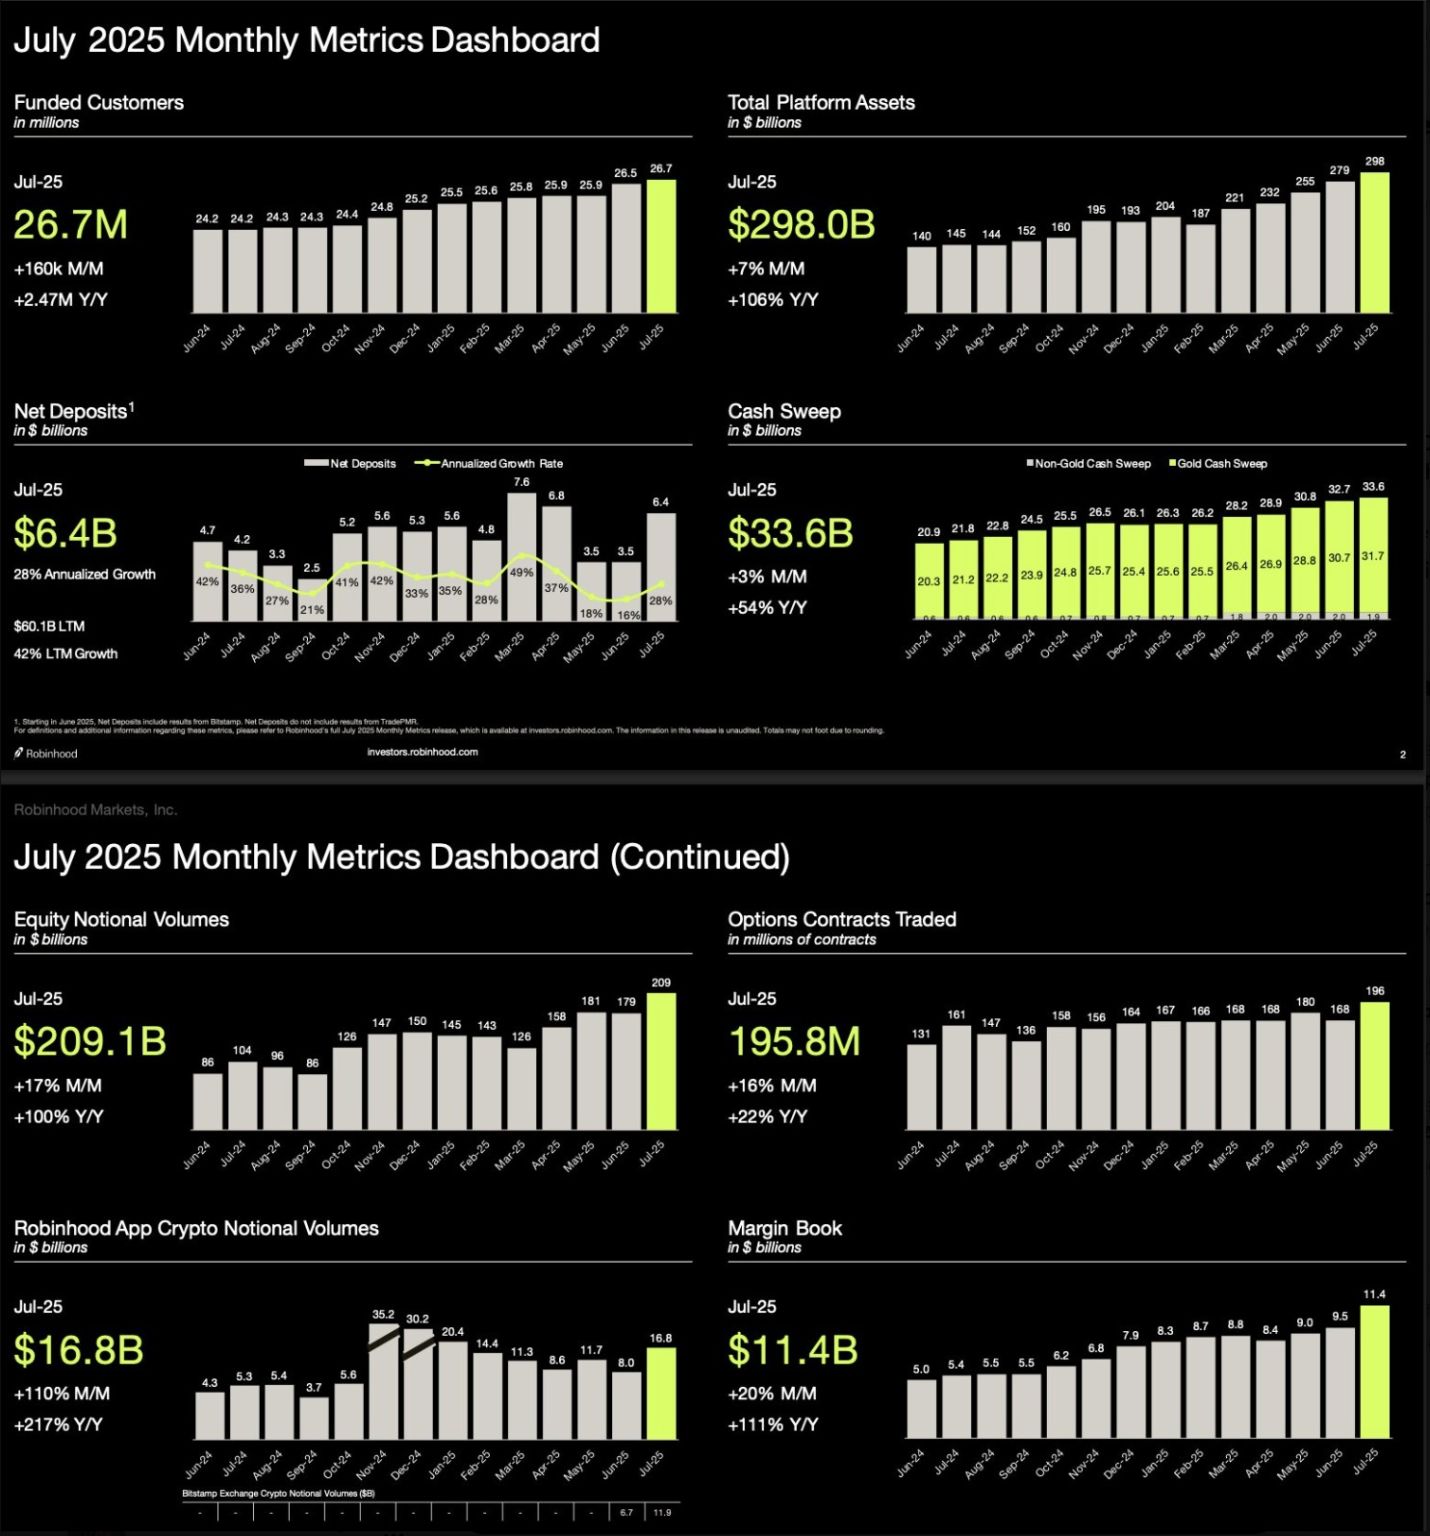
Robinhood $HOOD July 2025 metrics
+160K funded accounts +$298B Assets under Custody (AUC), +106% YoY +$6.4B in net deposits, +28% YoY +$33.6B in cash sweep, +54% YoY +$209B in equities trading volumes, all time high +$196M option contracts traded, all time high +$16.8B crypto volumes, +217% YoY +$11.4B margin balances, +111% YoY Absolutely incredible execution. Source: amit @amitisinvesting $HOOD
US small-caps are breaking higher in a substantial factor rotation.
As highlighted by Andreas Steno Larsen on X, being short Russell 2000 index is a very crowded trade. A short-squeeze in the making?
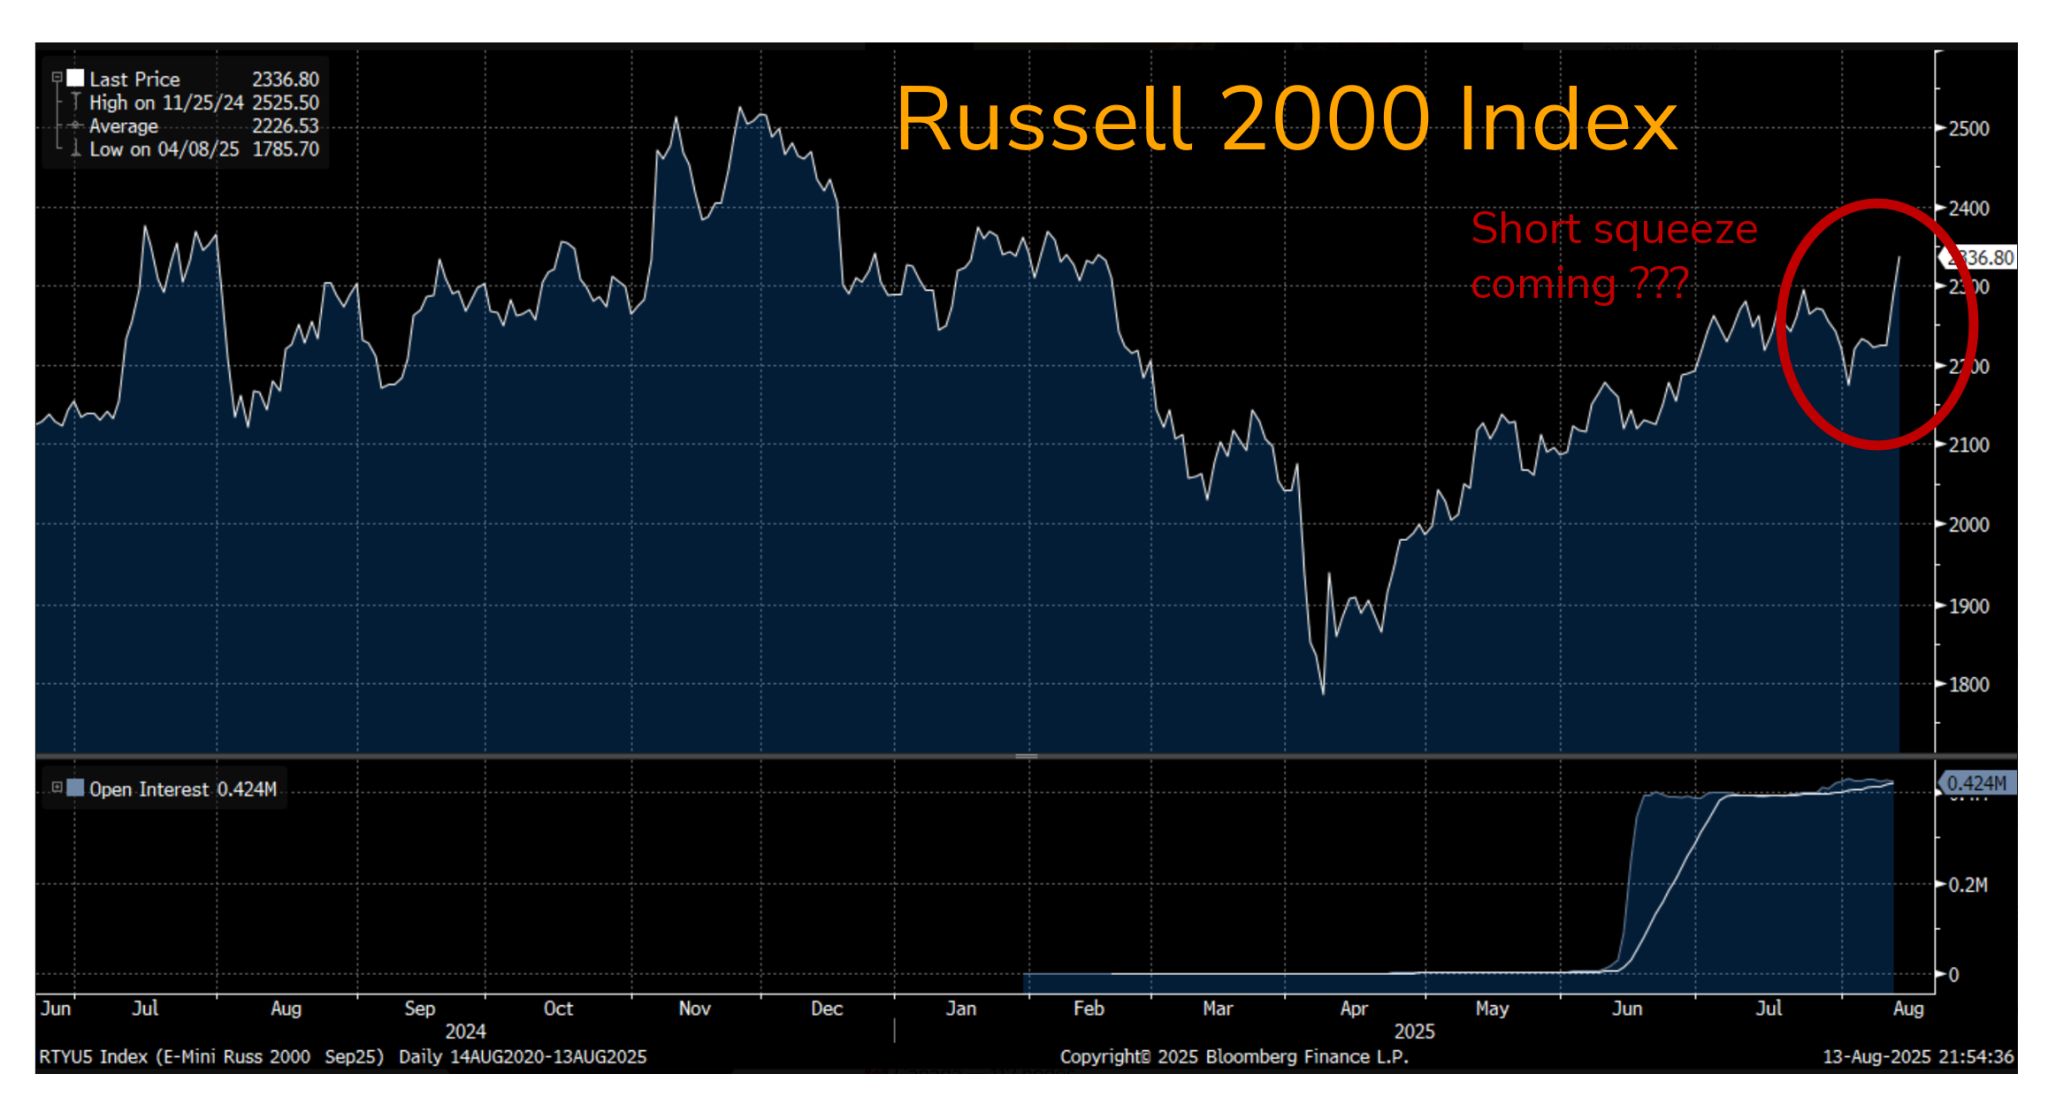
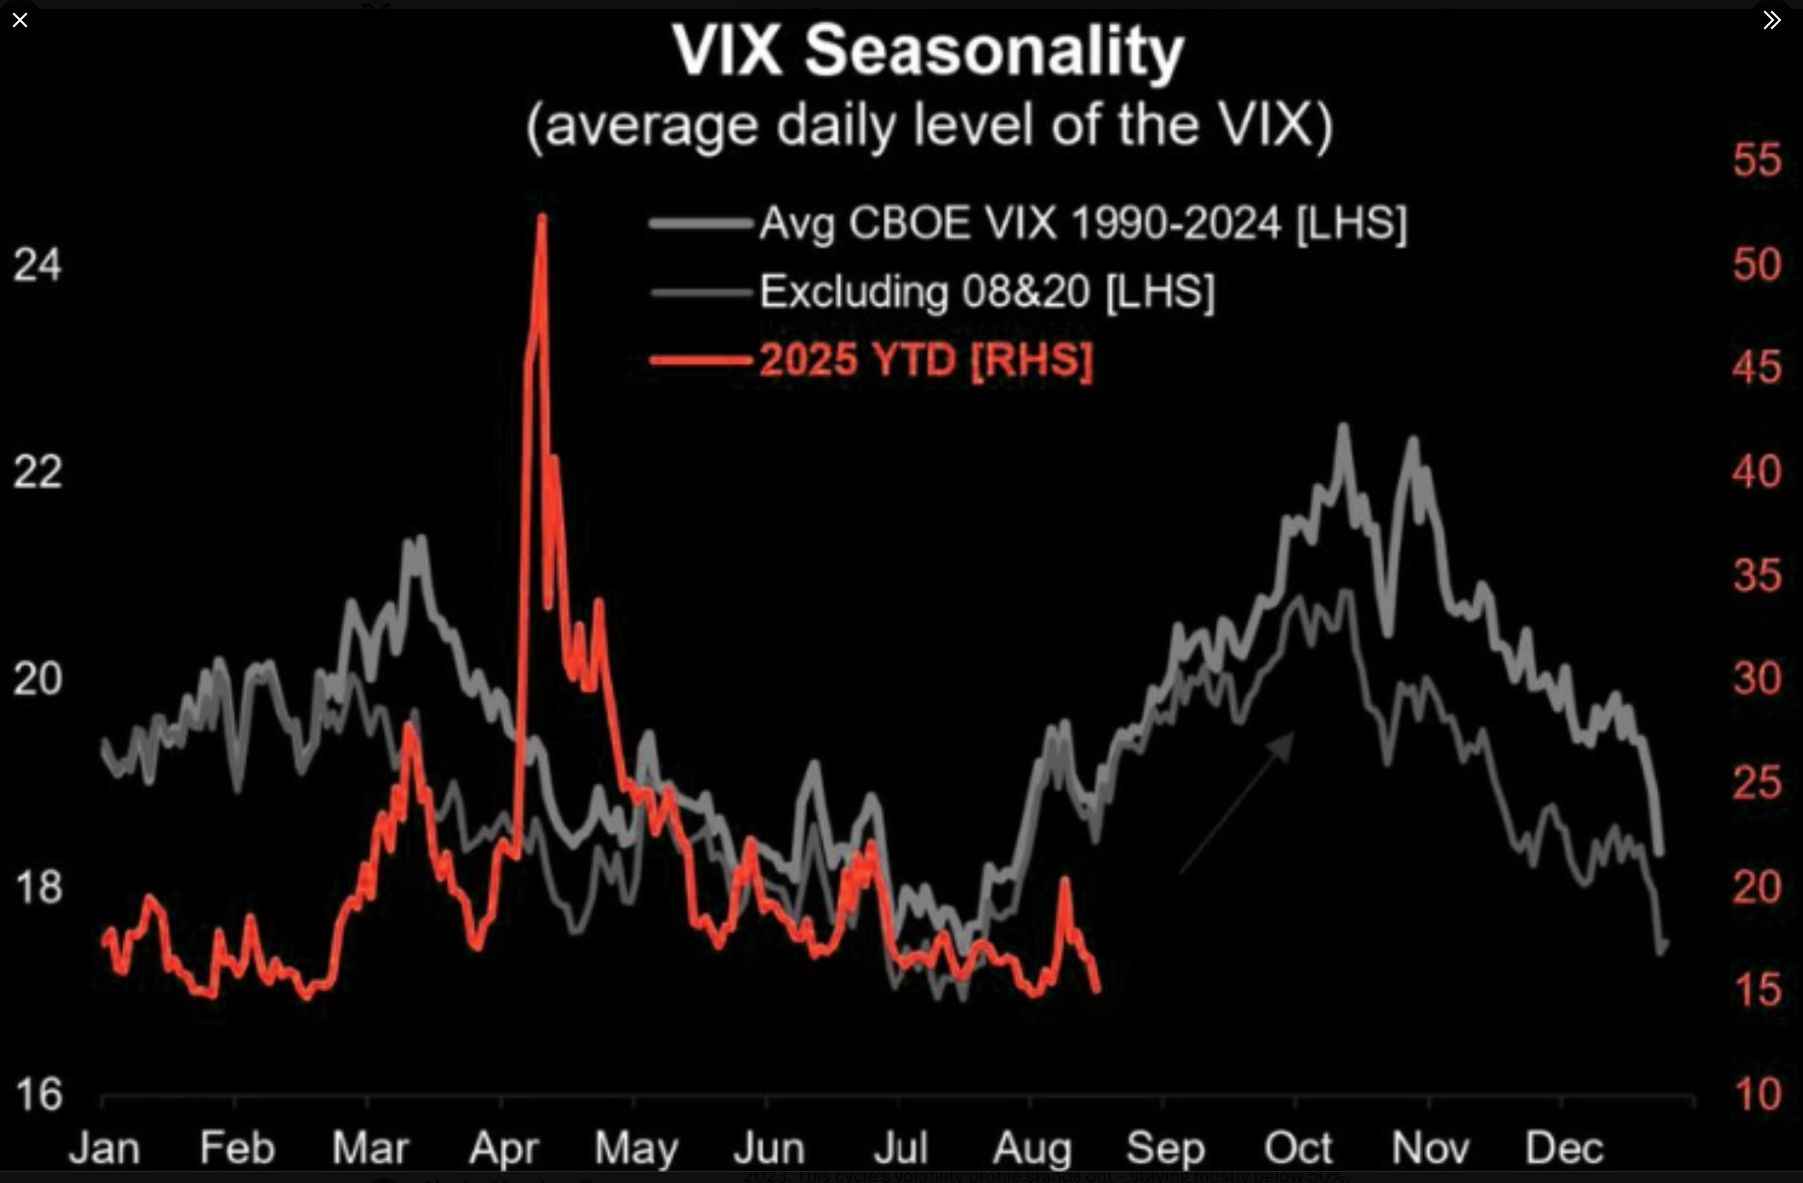
Isn't this the time of year when volatility typically picks up?
Source: Lance Roberts