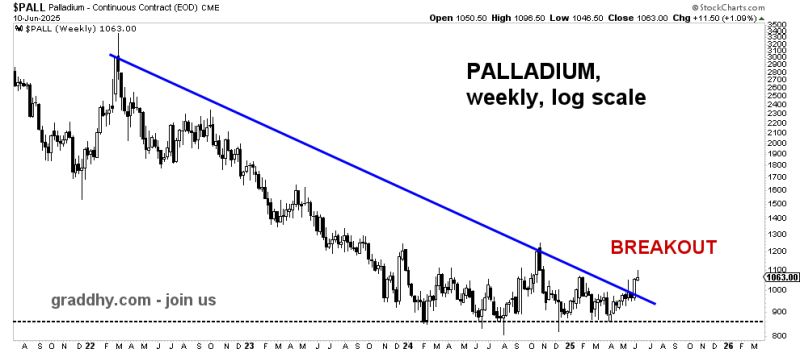
A major breakout for palladium
Source: Graddhy - Commodities TA+Cycles
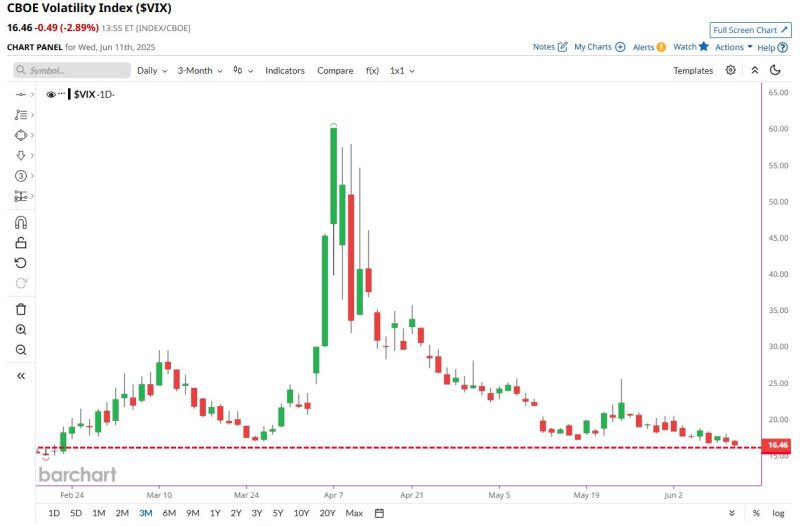
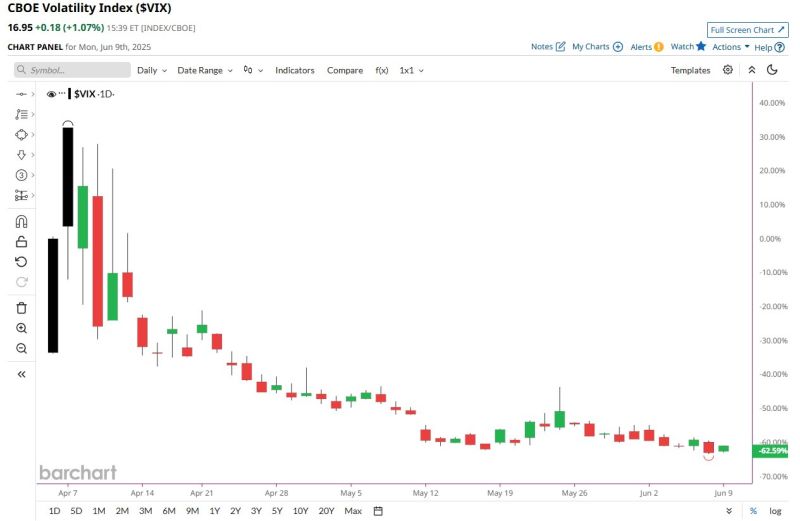
CBOE Volatility Index $VIX falls to lowest level since February
No Fear Left in the Market Source: Barchart
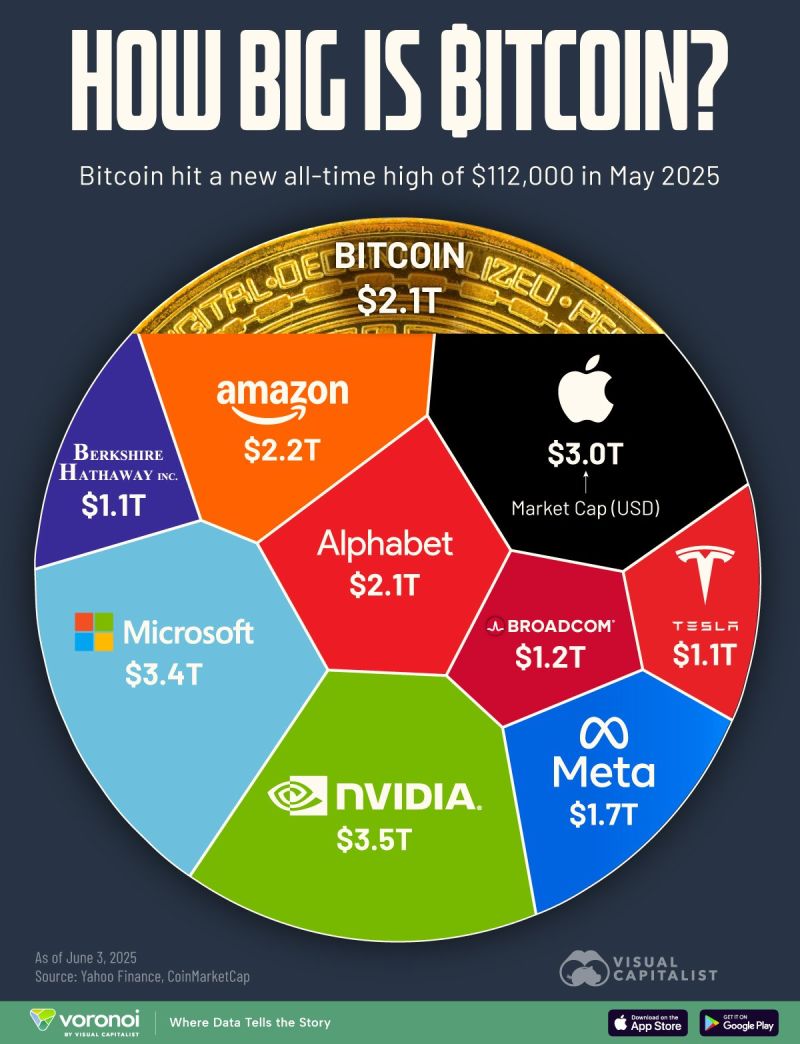
Bitcoin $BTC compared to the World's Biggest Companies
Source: Visual Capitalist
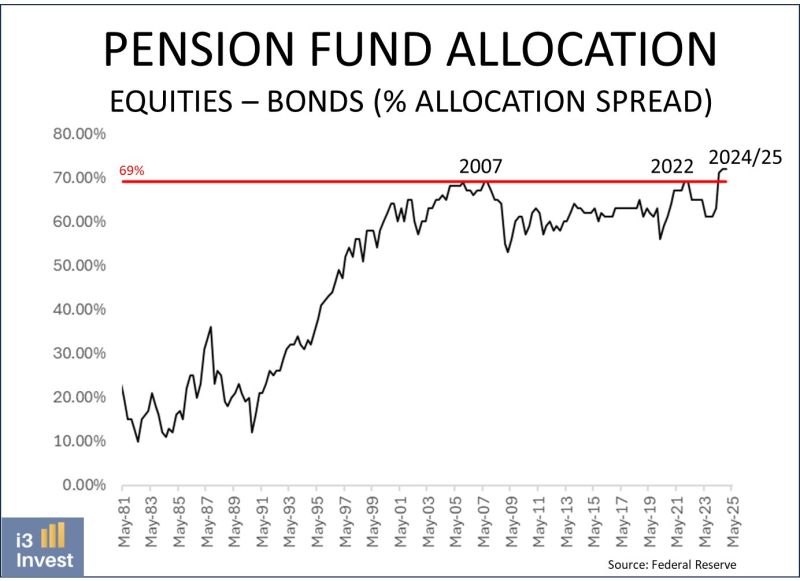
US pension fund allocation to equities relative to bonds is at an all-time high.
U.S. pension funds represent approximately 20% of the total U.S. financial markets. Source: Guilherme Tavares @i3_invest
BREAKING: Volatility
CBOE Volatility Index has plummeted 63% over the last 9 weeks, the largest volatility crush in history Source: Barchart
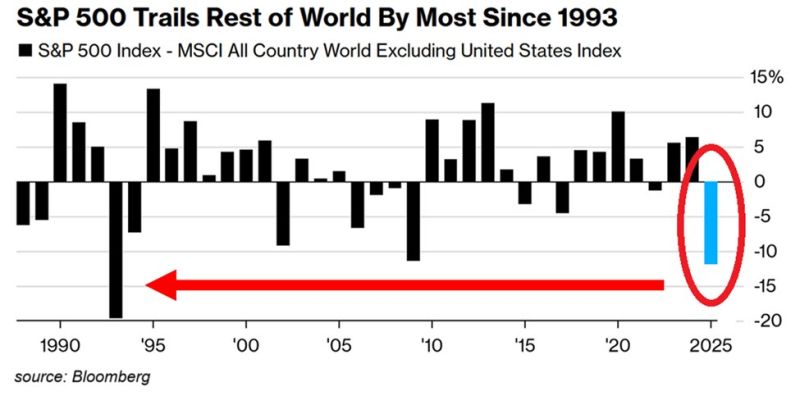
⚠️Despite US stocks outperformance in May, this is one of the WORST years for the US stock market in history:
The S&P 500 has UNDERPERFORMED World stocks excluding the US by 12 percentage points year-to-date, the most in 32 YEARS. Source: Bloomberg, Global Markets Investor
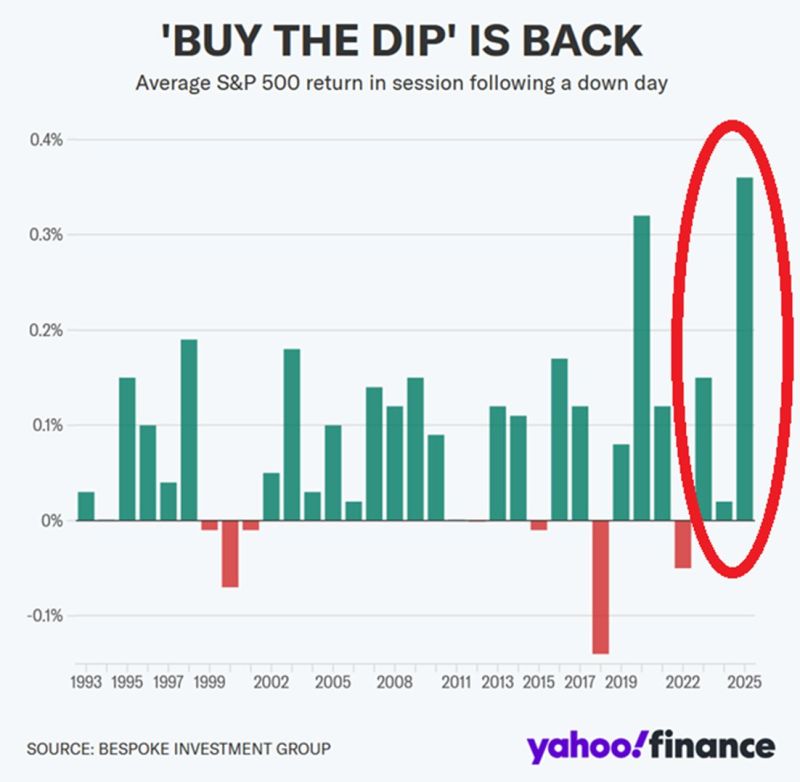
🚨Retail investors have bought every dip this year
The S&P 500 has returned 0.36% on average following a down day, the most ever recorded. By comparison, last year it was just 0.02%. Retail investors purchased over $50 billion in US equities since the April low. Source: Yahoo Finance, Global Markets Investor
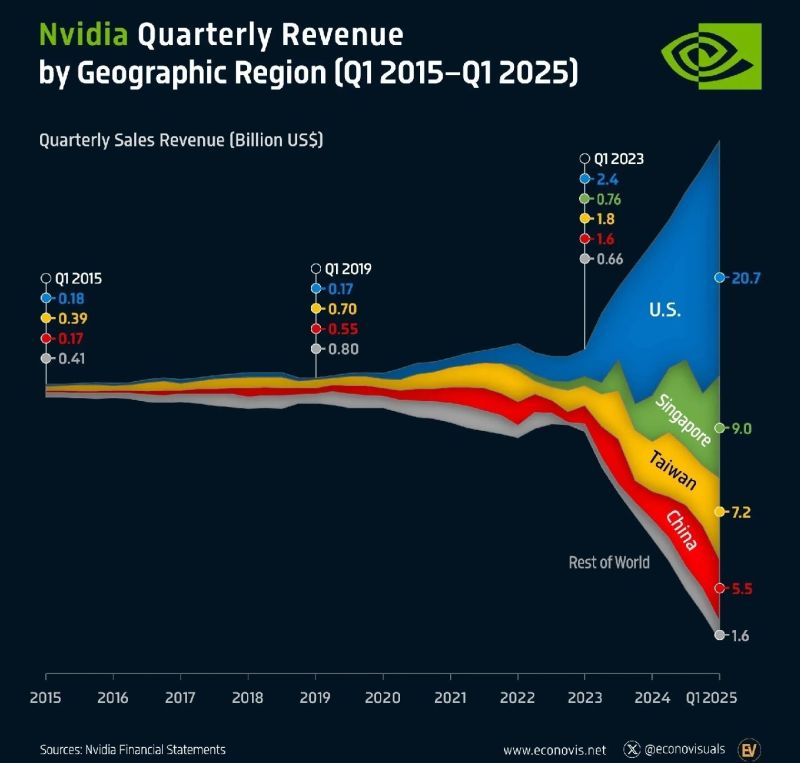
Nvidia quarterly revenues by regions over time...
Up to 20% of Nvidia’s revenue comes from Singapore a known gateway to China and when including direct sales to China and Hong Kong, roughly one-third of its total revenue ($15 billion) may be exposed to Chinese market risk. Source: econovisuals