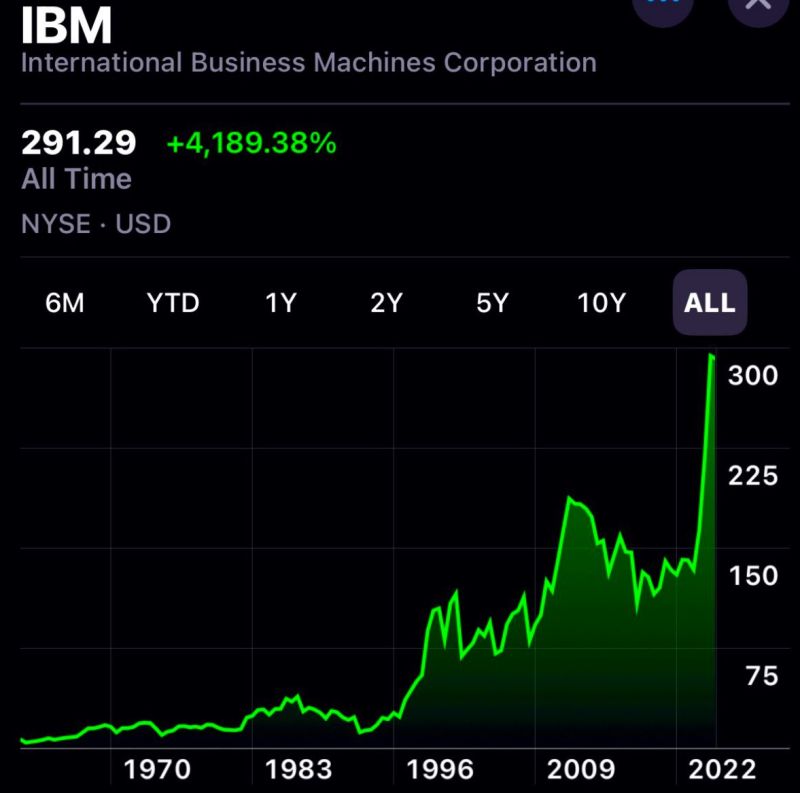
Remember IBM?
Over the past 5 years, it has outperformed: • Microsoft • Apple • Google Source: Brew markets
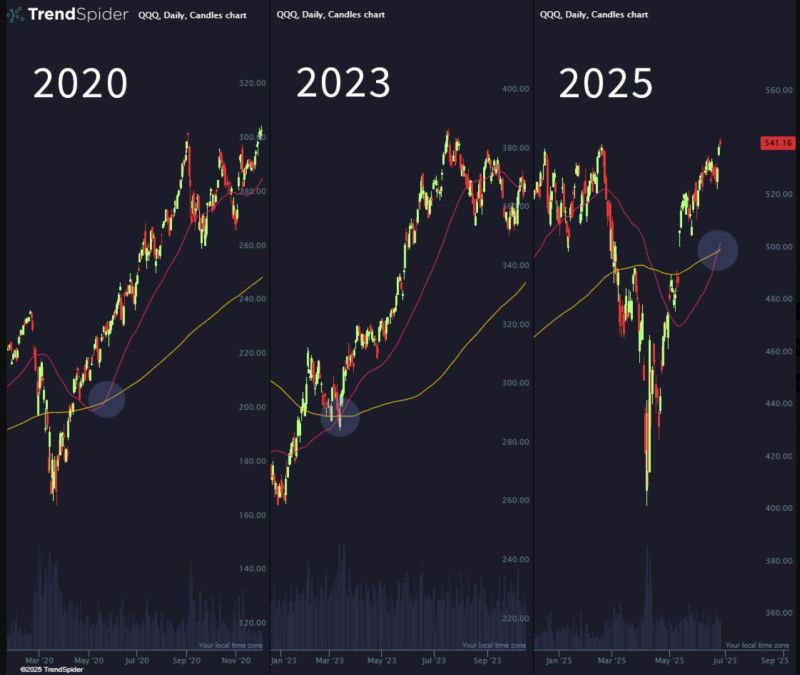
The last two golden crosses on $QQQ did not disappoint...
What do we have in store this time around? Source: Trend Spider
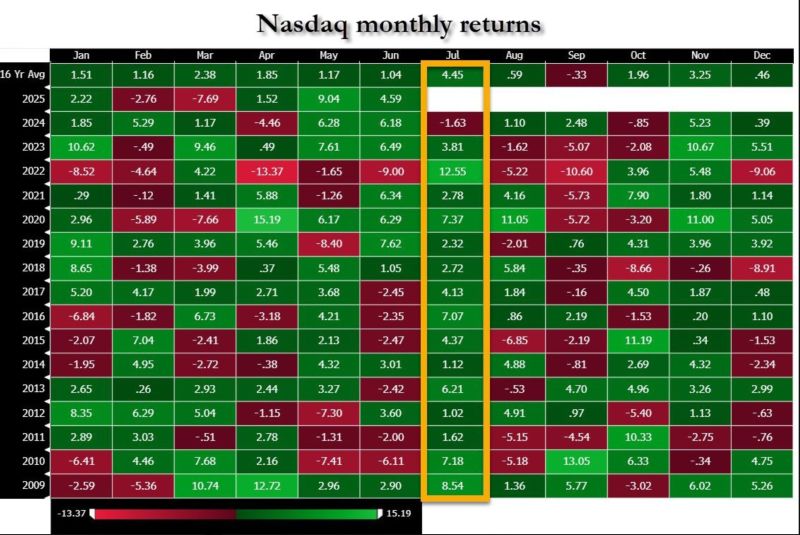
Nasdaq seasonality in July is something else
Source: zerohedge
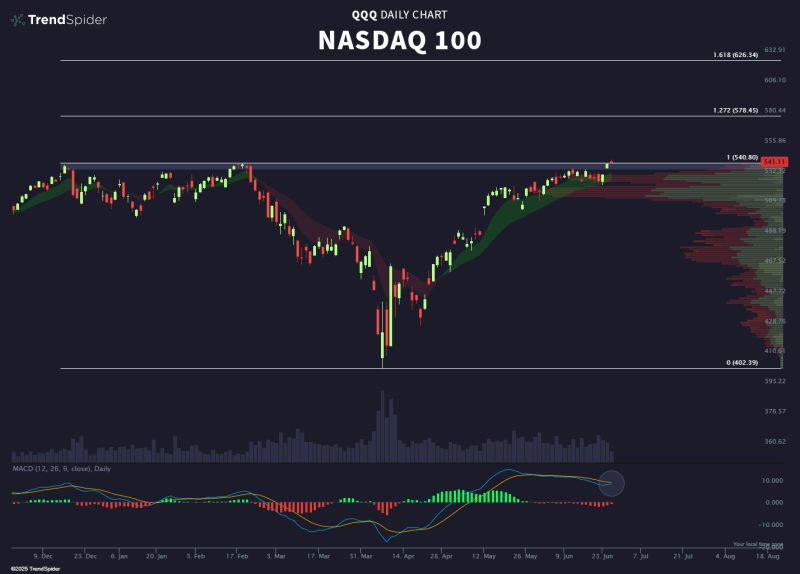
$QQQ Nasdaq 100 Fibonacci extensions, just in case the party keeps going above ATHs.
Source: Trend Spider
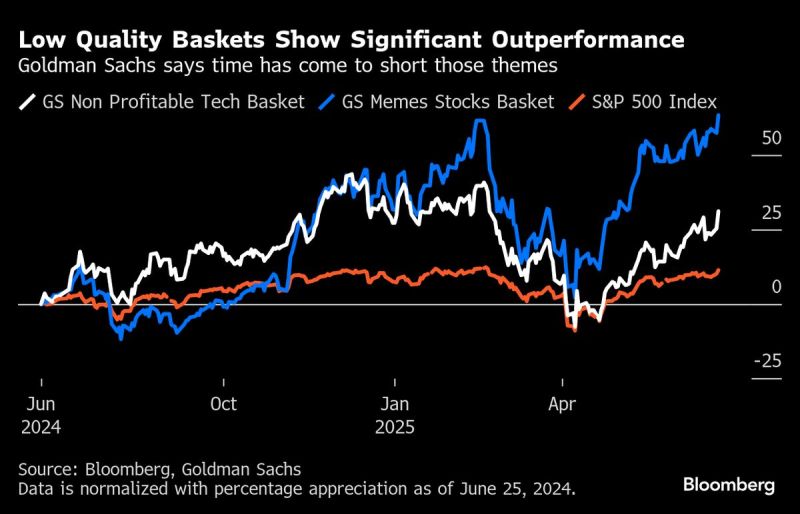
Who’s outperforming the SP500 over the past year?
The memes Source: Kevin Gordon @KevRGordon, Bloomberg
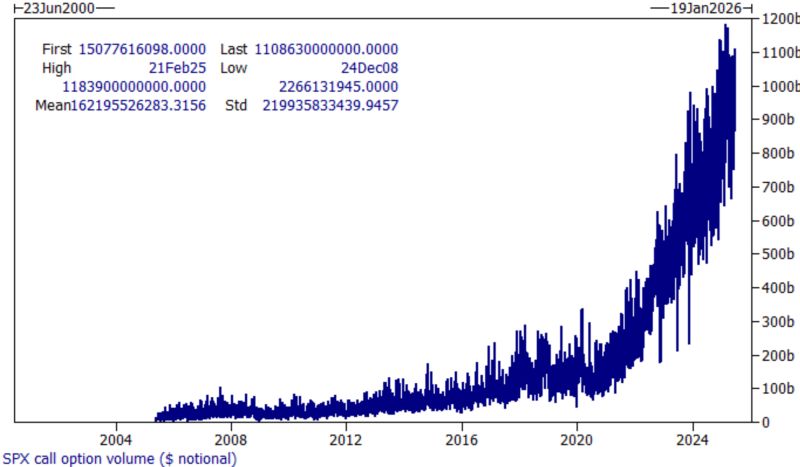
$SPX call option volume has surged to completely unprecedented heights over the last four years.
We see over $1.2 trillion in notional trading daily, with over 50% of that expiring the same day, and 75-80% within a week. Short-dated flows have a BIG influence on the market. Source: Markets & Mayhem
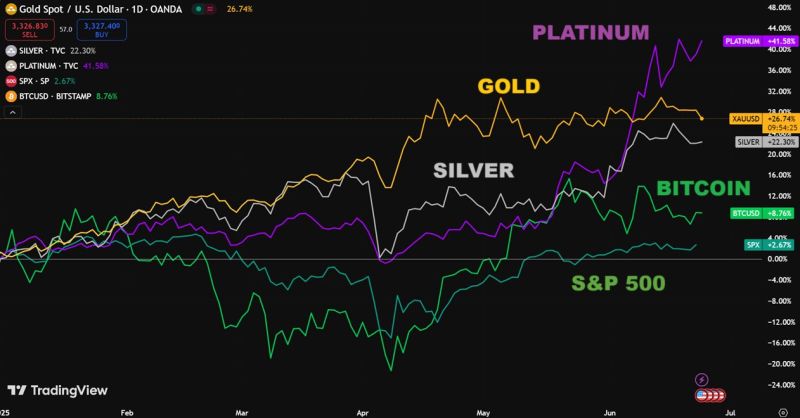
So far, this has been the year of precious metals🔥
Performance year-to-date: Platinum +42% Gold +27% Silver +22% Bitcoin +9% The S&P 500 +3% Since the beginning of 2024: Bitcoin +149% Gold +63% Silver +52% Platinum +33% S&P 500 +26% Source: Global Markets Investor
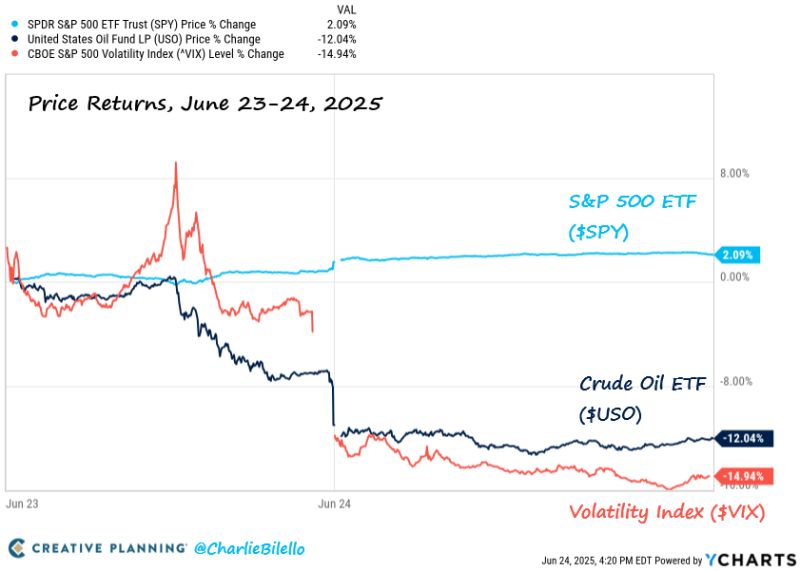
Who would have expected this?
The US bombed Iran over the weekend. Naturally, the SP500 rose 2% on Monday-Tuesday while Crude Oil fell 12% and the hashtag#Volatility Index $VIX crashed 15%. Just as everyone predicted… Source: Charlie Bilello