Straight from the Desk
Syz the moment
Live feeds, charts, breaking stories, all day long.
- All
- equities
- United States
- Macroeconomics
- Food for Thoughts
- markets
- Central banks
- Fixed Income
- bitcoin
- Asia
- europe
- investing
- technical analysis
- geopolitics
- gold
- Crypto
- AI
- Commodities
- Technology
- nvidia
- ETF
- earnings
- Forex
- china
- Real Estate
- banking
- oil
- Volatility
- energy
- magnificent-7
- apple
- Alternatives
- emerging-markets
- switzerland
- tesla
- United Kingdom
- Middle East
- assetmanagement
- amazon
- russia
- ethereum
- microsoft
- ESG
- meta
- Industrial-production
- bankruptcy
- Healthcare
- Turkey
- Global Markets Outlook
- africa
- Market Outlook
- brics
- performance
AstraZeneca retesting April downtrend
AstraZeneca (AZN LN) is back on April downtrend. This is a retest of September breakout. Keep an eye. Source : Bloomberg
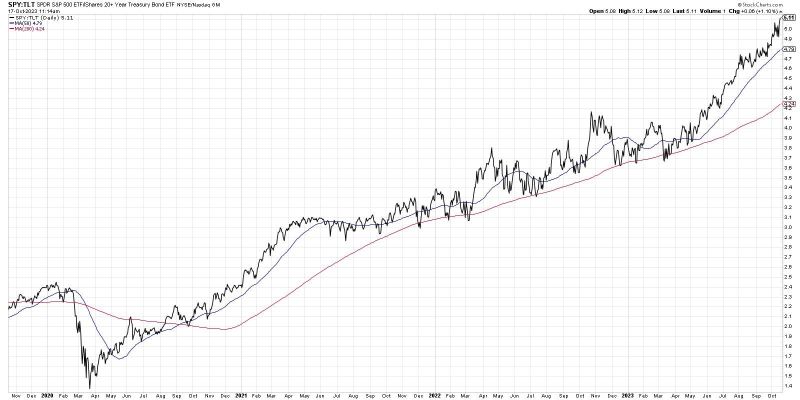
Below a chart of stocks $SPY (S&P 500) vs. bonds $TLT (iShares 20y+ US Treasuries), just as a reminder of the persistence and longevity of this relative trend
Source: David Keller
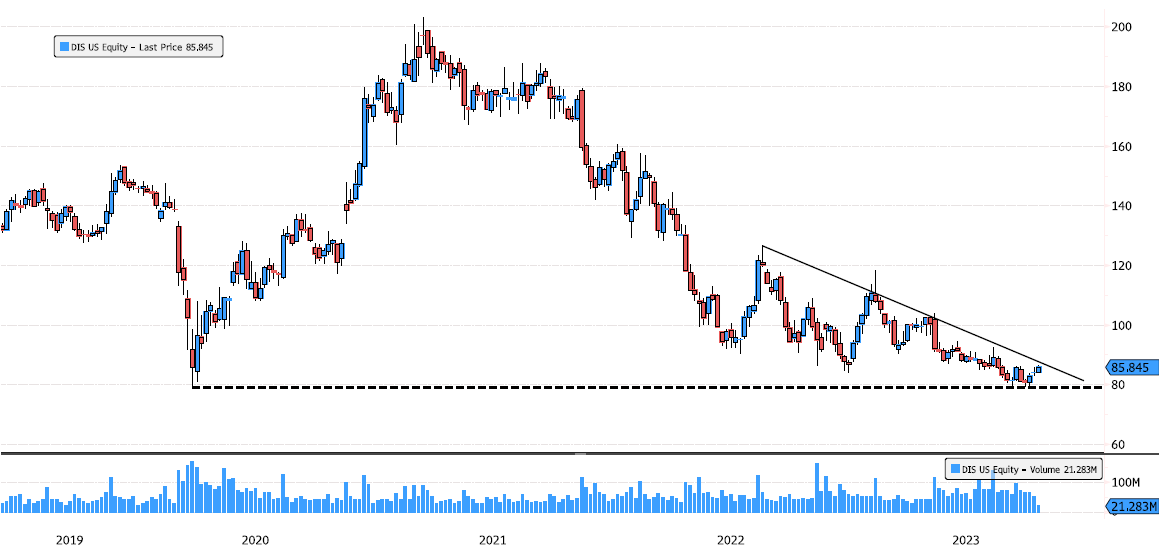
Disney towards the end of the triangle
Disney (DIS US) has now consolidated 30% since March 2021 highs. Volatility is contracting. Keep an eye on these levels. August 2022 downtrend around 88 and March 2020 support at 79. Source : Bloomberg
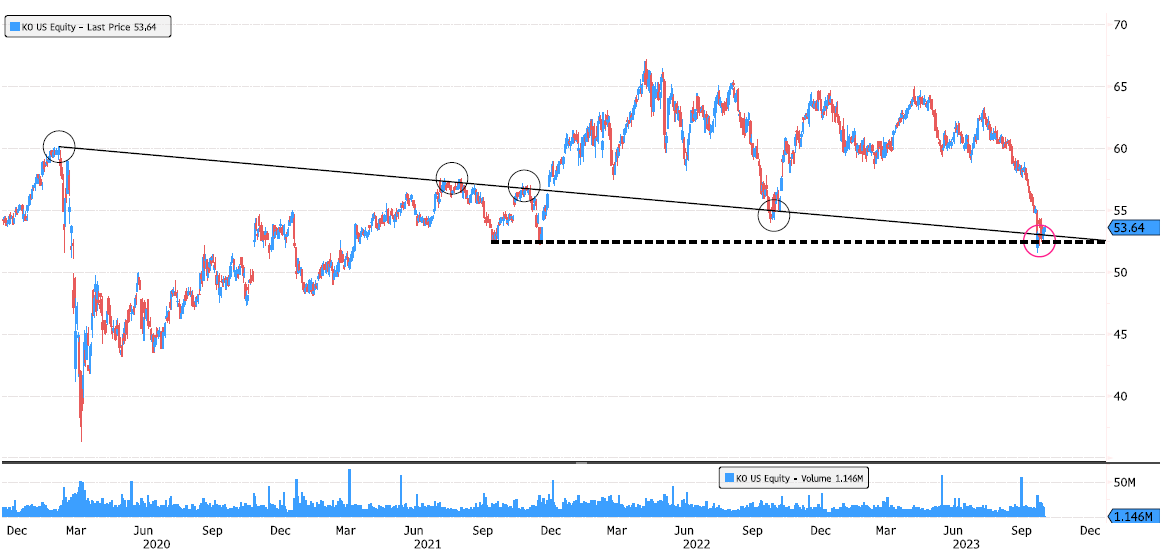
Coca-Cola on a major level
Coca-Cola (KO US) is back on September and December 2021 support. It is also back on February 2020 downtrend resistance acting as support now. Keep an eye. Source : Bloomberg
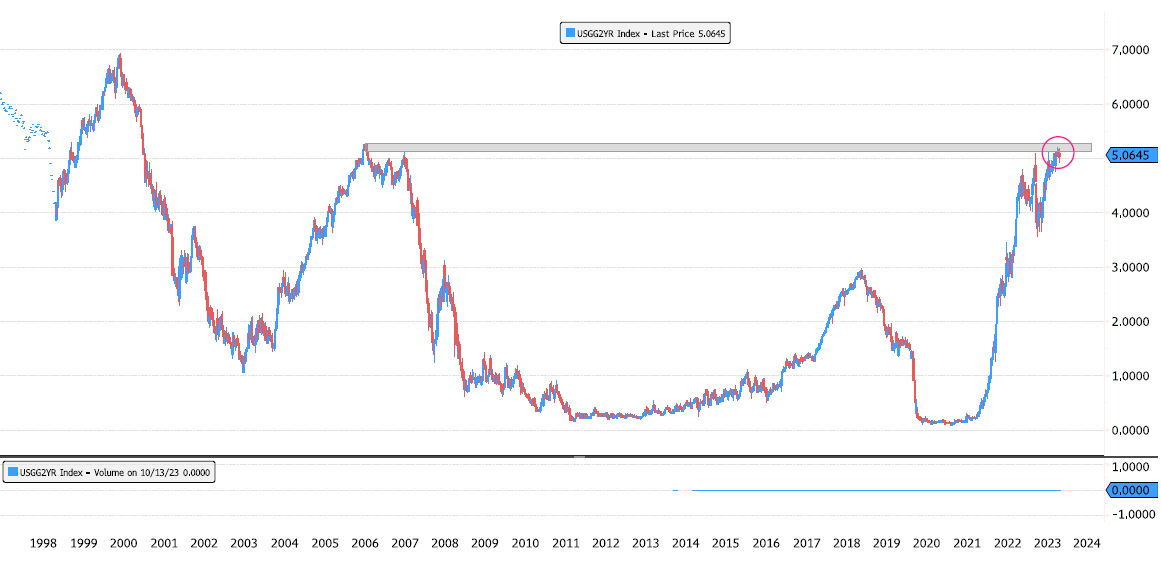
US Gov 2 year yield reaching major resistance zone
US Gov 2 year yield (USGG2YR Index) has reached major resistance zone 5.128-5.275. This zone is represented by the highs of 2006 and 2007. Keep an eye. Source : Bloomberg
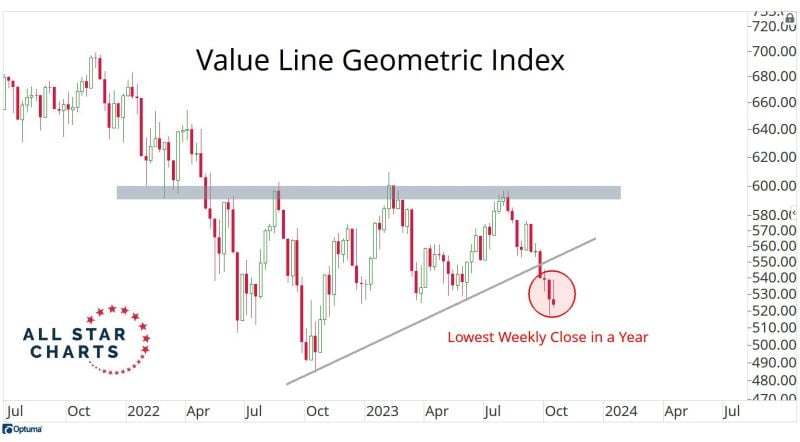
Here's an index that represents the median stock closing last week at the lowest levels in a year
Source: J-C Parets
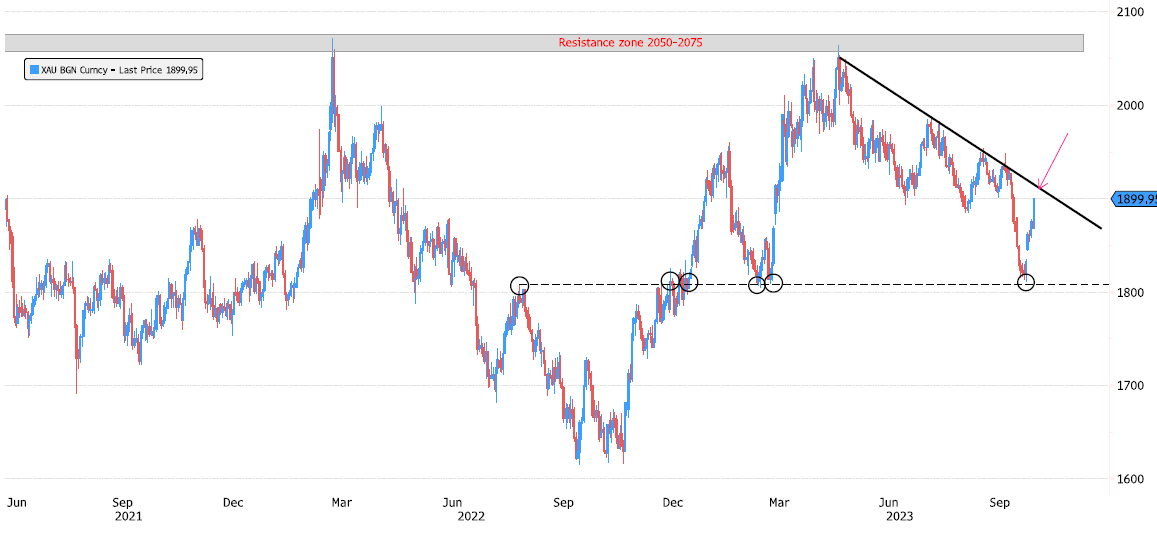
Gold approaching short term May downtrend resistance
Gold (XAU) recent rebound confirms that the bullish trend remains in place. Keep an eye at May short term downtrend resistance. Source : Bloomberg
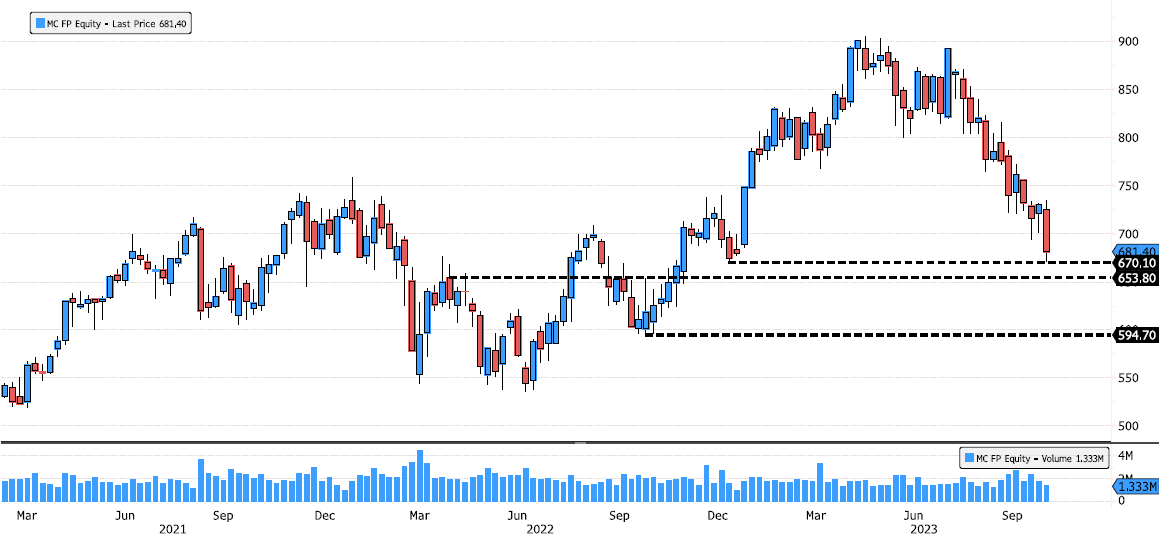
LVMH desperately trying to find support
LVMH (MC FP) is now dropping 25% since April high. Stock is trying to find some support for a technical rebound in this bearish trend. Keep an eye at 670 support. If broken next support is 654. Source : Bloomberg
Investing with intelligence
Our latest research, commentary and market outlooks


