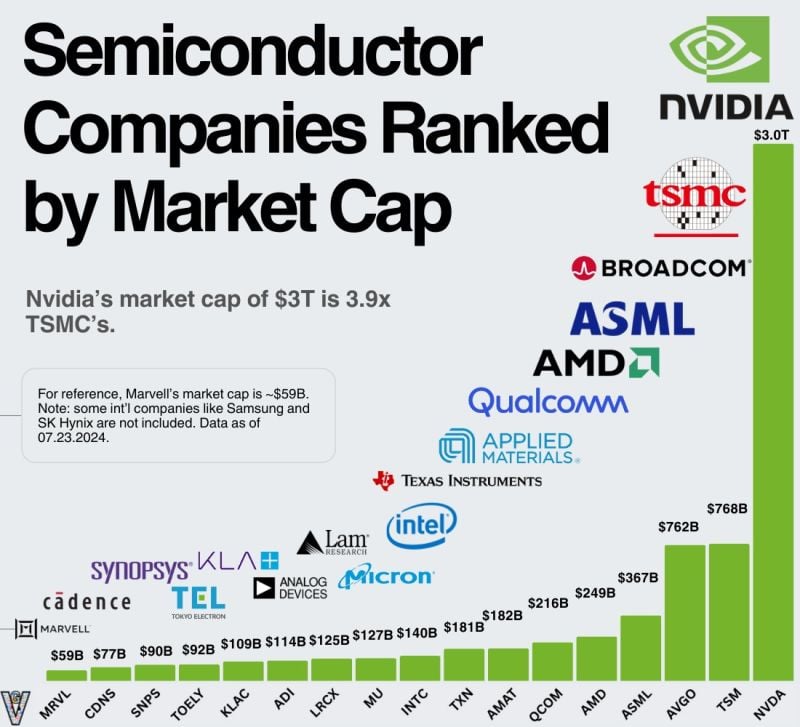
Semi conductors Companies Ranked by Market Cap - @EricFlaningam on X:
1)The scale of the industry is incredible. Many public companies larger than $10B aren’t listed here. 2) $NVDA's performance over the last two years has to be one of the best tech stories ever. Incredible how they built their accelerated computing ecosystem for over a decade before the current infrastructure boom.
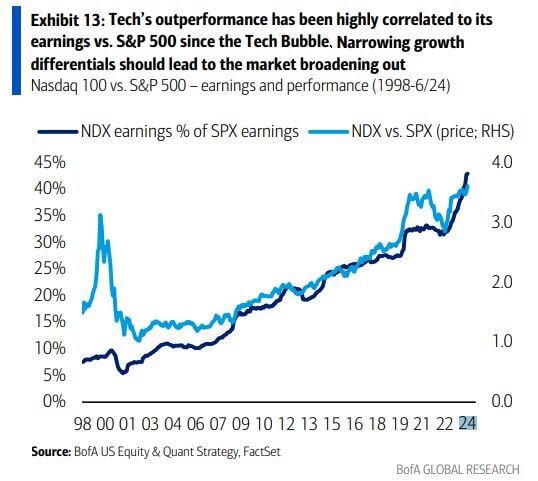
Tech’s outperformance has been highly correlated to its earnings vs. S&P 500 since the Tech Bubble
Source: BofA, Mike Z.
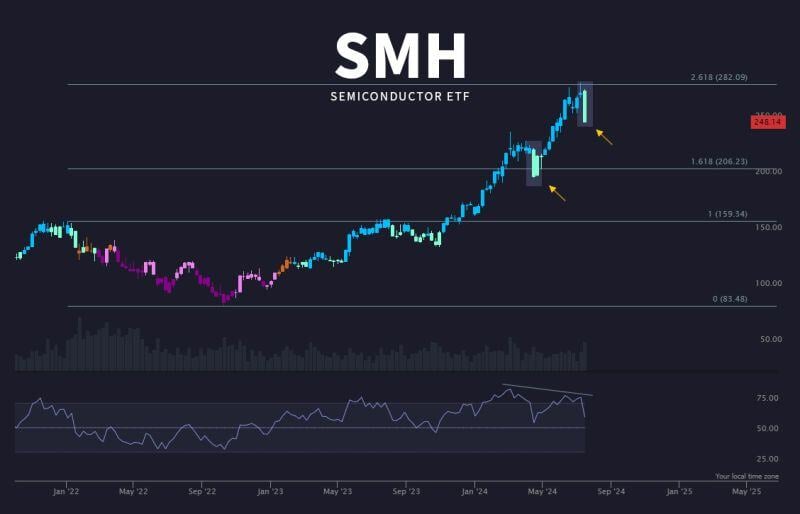
This is not the first correction $SMH semiconductors ETF is going through
Source: Trend Spider
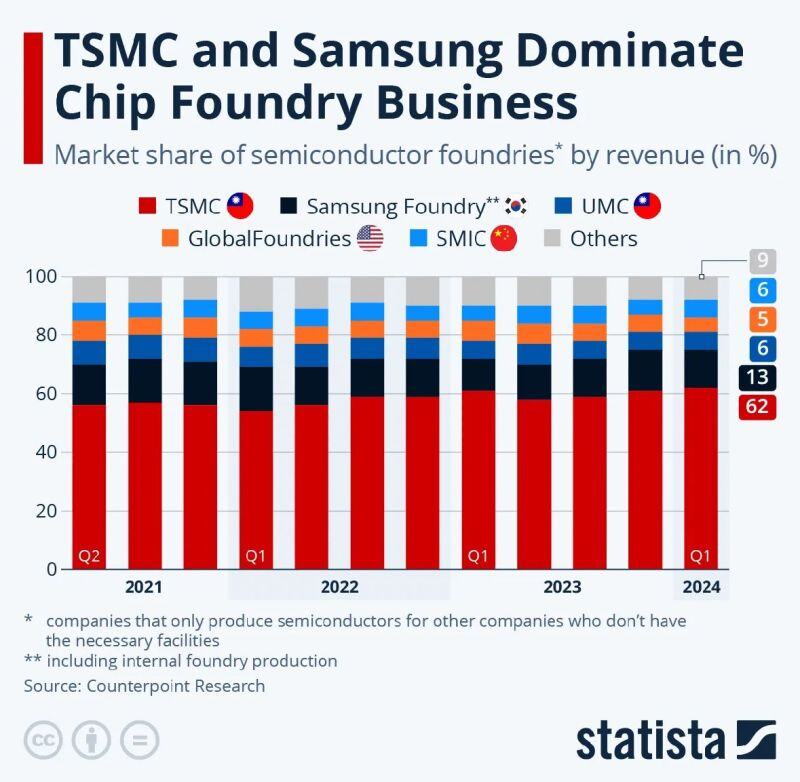
The semi-conductor foundry landscape
Source: Statista
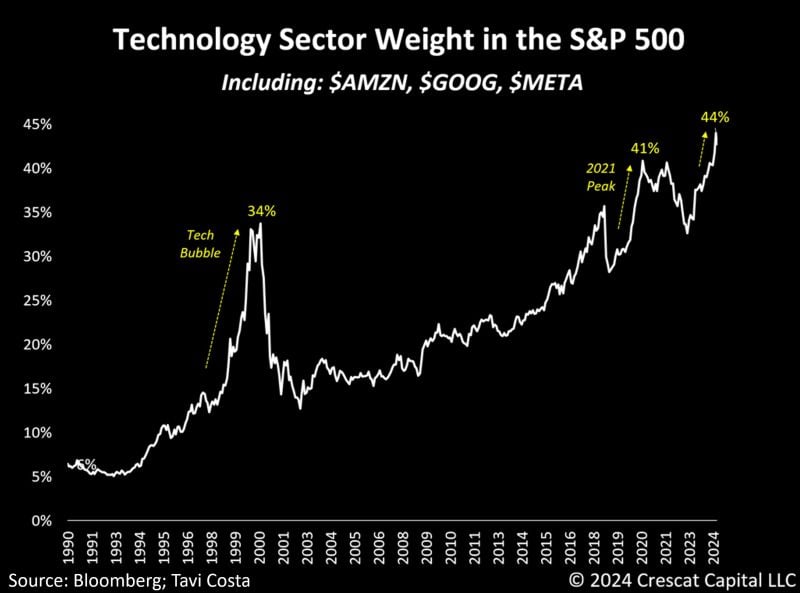
Meanwhile: The tech sector now represents 44% of the S&P 500 index when including Amazon, Alphabet, and Meta.
The pendulum has probably swung too far in one direction, and investors are running out of ideas to justify these historical distortions. Source: Tavi Costa, Bloomberg
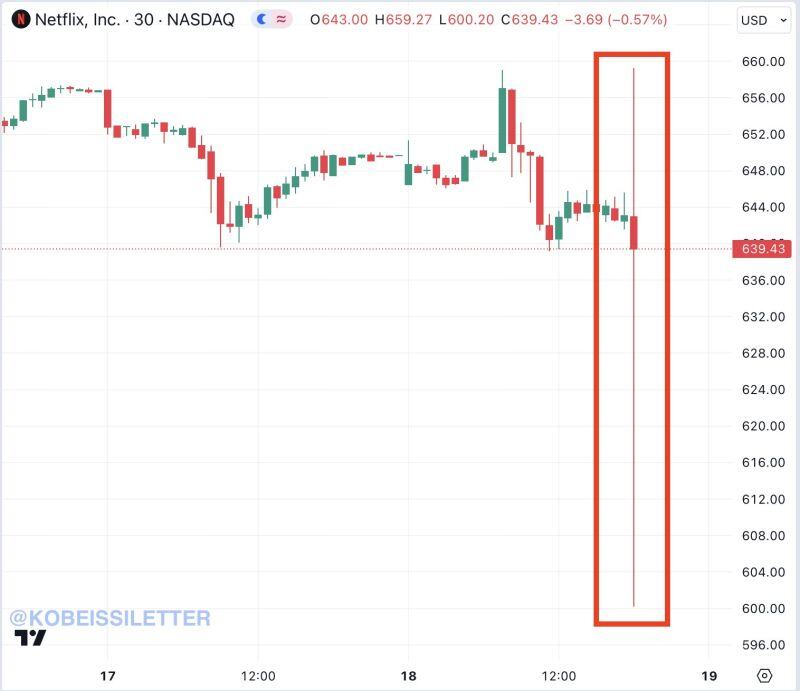
Netflix, $NFLX, officially kicks off big tech earnings season with a MASSIVE swing in price.
The stock just swung over 10% in a matter of minutes after reporting results. The company reported Q2 2024 EPS of $4.88, above expectations of $4.76. They also added 8.05 million subscribers, crushing expectations of 4.5 million. Big tech earnings season has officially begun. Source: The Kobeissi Letter
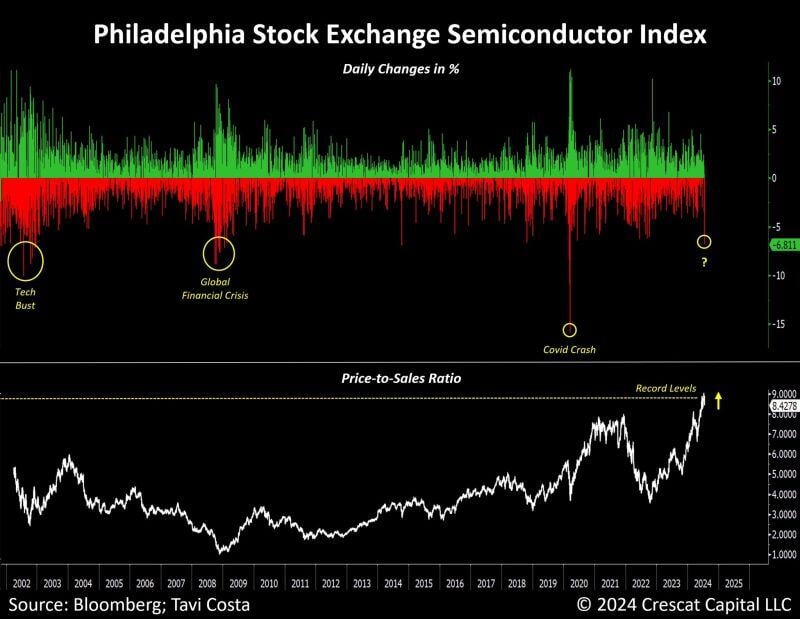
We just saw the largest selloff in the semi-conductors SOX index since the pandemic crash
It is taking place at the time valuations are at record high (see below price-to-sales in the chart underneath) Source: Bloomberg, Tavi Costa
Will this time be different?
Source: BofA