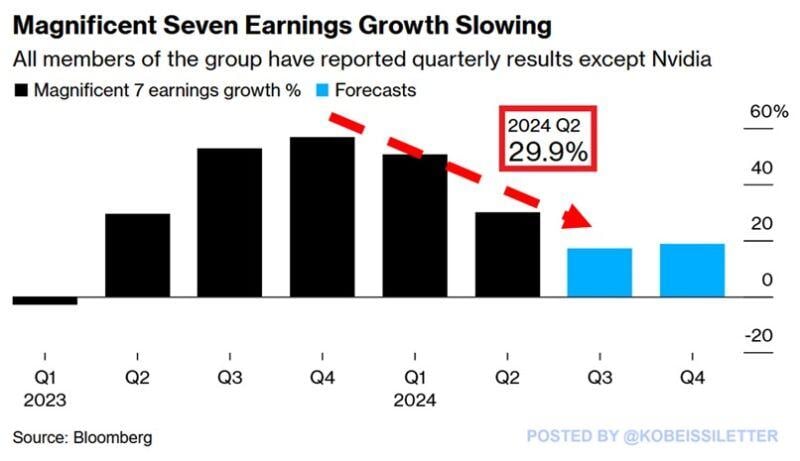
Has the Magnificent 7's earnings growth peaked?
In Q2 2024, the Magnificent 7' net income, excluding Nvidia, $NVDA, rose by 30% year-over-year, the slowest growth since Q2 2023. This is down from 51% in Q1 2024 and below the record 57% seen in Q4 2023. It is estimated that the growth rate will decelerate further to ~17% in Q3 2024. Source: The Kobeissi Letter
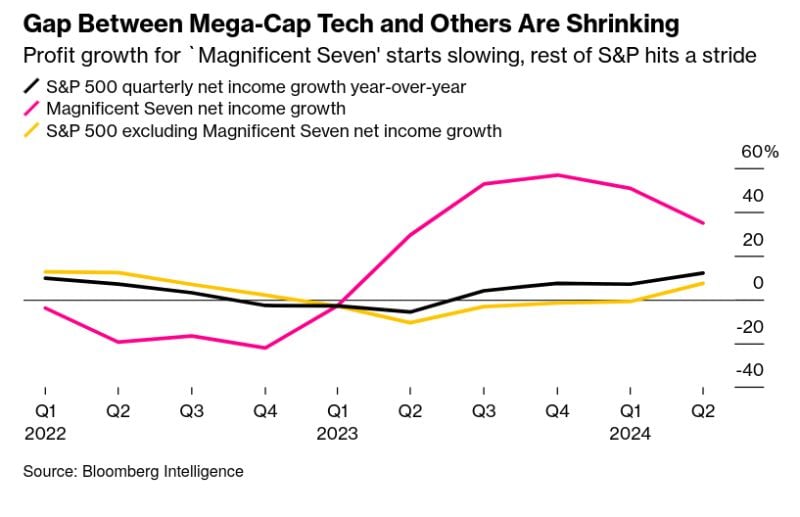
As the Mag 7 slow the rest of the SP500 is showing signs of improving growth
Source: Bloomberg intelligence, Markets & Mayhem
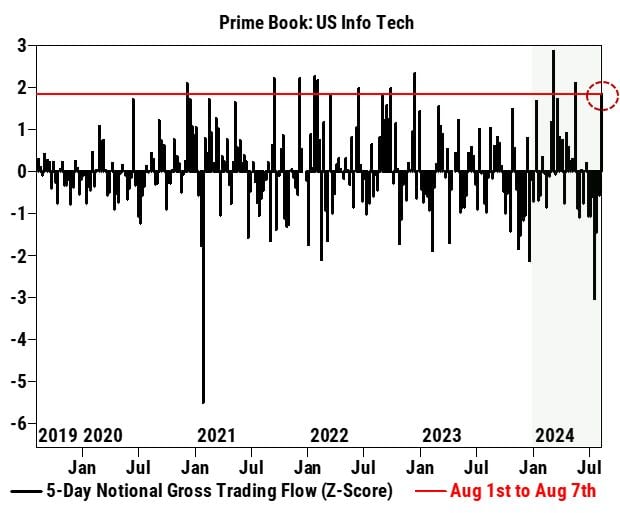
Hedgefunds are buying the dip in tech, per Goldman
Source: Goldman Sachs, Markets & Mayhem
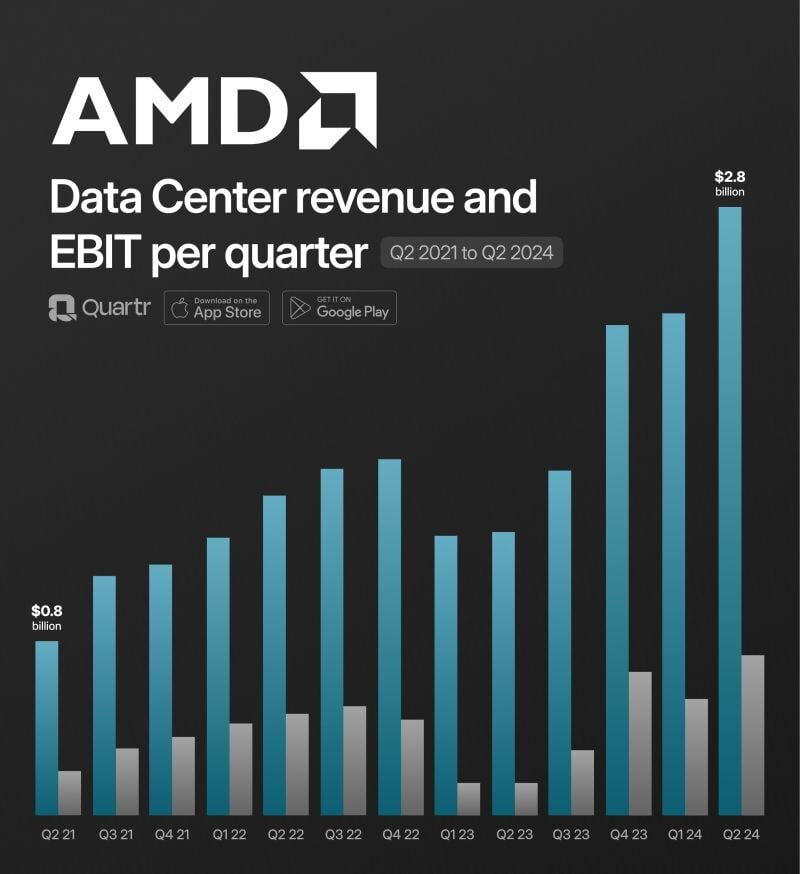
$AMD Q2 2024: "Our AI business continued accelerating and we are well positioned to deliver strong revenue growth in the second half of the year" - Lisa Su, CEO
Details by Quartr: Revenue +9% *Data Center +115% *Client +49% *Gaming -59% *Embedded -41% Gross Profit +17% *marg. 49% (46%) EBIT +1445% *marg. 5% (0) EPS +700%
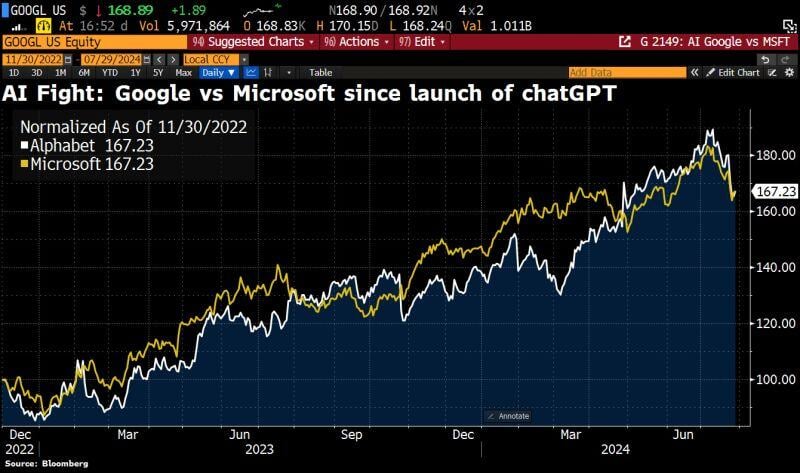
Microsoft and Alphabet are now exactly on par since the launch of ChatGPT at the end of November 2022.
Source: HolgerZ, Bloomberg
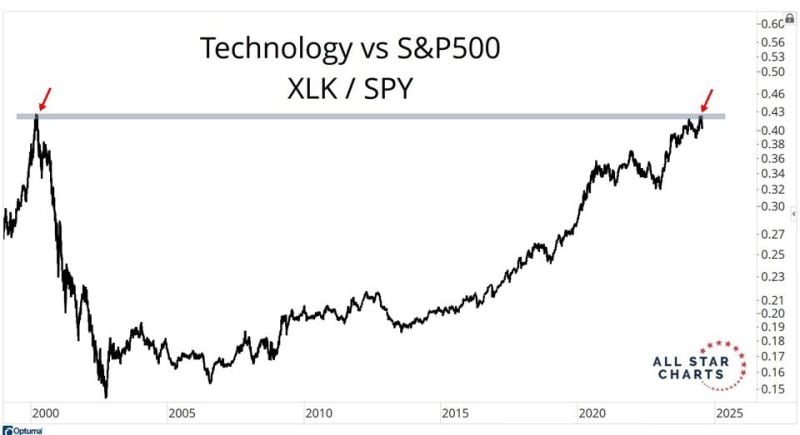
The last time Tech stocks were at these levels relative to the S&P500, Tech stocks crashed, particularly relative to the rest of the market.
Source: J-C Parets
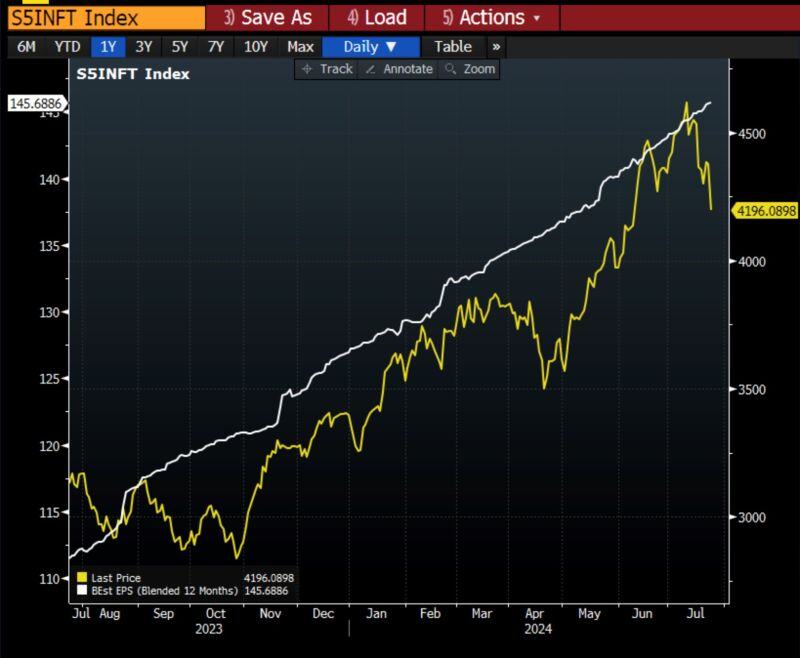
One for the Bulls... As shown below, during this tech pullback, forward 12-months EPS in tech has actually ticked higher.
So you could argue that this is mostly a positioning and sentiment pullback, especially in tech... Source: Bloomberg, RBC
Thank you Crowdstrike... that's soooo king of you....
Source: Barchart