DAX Index nearing key support !
Since the July 10th highs, the DAX has pulled back more than 5%, while the S&P 500 gained around 5% over the same period. The index is now approaching a major support zone at 23,050–23,250. Watch closely in the coming days — price action around these levels could be decisive. Source: Bloomberg

Chocoladefabriken Lindt – Retesting Breakout Level
After a consolidation of more than 16% since the June highs, Lindt has now come back to retest the support zone at 11'090–11'750, which also coincides with the February breakout level. We’re seeing constructive price action on the shorter timeframes, suggesting that this level is attracting buyers and could act as a solid base. Source: Bloomberg

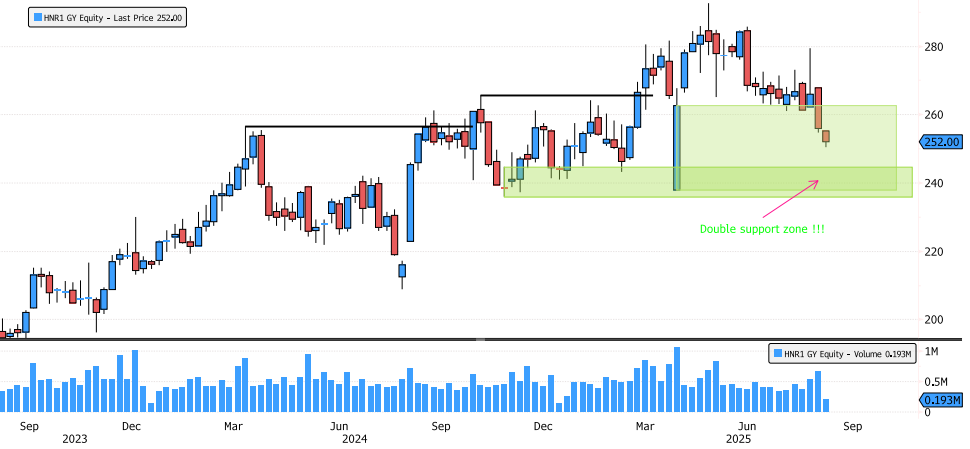
Hannover Rück Approaching Double Support Zone
Hannover Rück has been in a bullish long-term trend since 2012! The last swing has consolidated 15% since the May highs, nearing the 78.6% Fibonacci retracement. The stock is now entering the major weekly swing support zone between 238-262, while also approaching the second major support zone from the January 2024 swing at 236-244. Keep an eye on the price action to confirm the potential end of this consolidation. Source: Bloomberg
Salesforce in a Good Spot!
Salesforce (CRM) has been consolidating since December 2024 and is now down 38%. The stock is back in the major swing support zone between 212-273. Last week was particularly interesting, with a break below the April lows creating a liquidity grab and a reversal, forming a Hammer candle. Source: Bloomberg

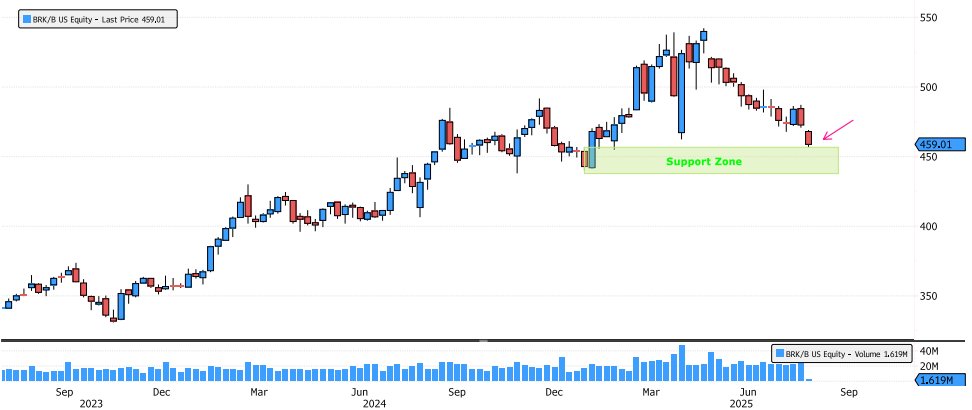
Berkshire Reaching Major Support Zone
Berkshire Hathaway has consolidated more than 15% since the May highs and is now approaching the major swing support zone between 440-456. Keep an eye on the price action over the next few days for potential developments. Source: Bloomberg
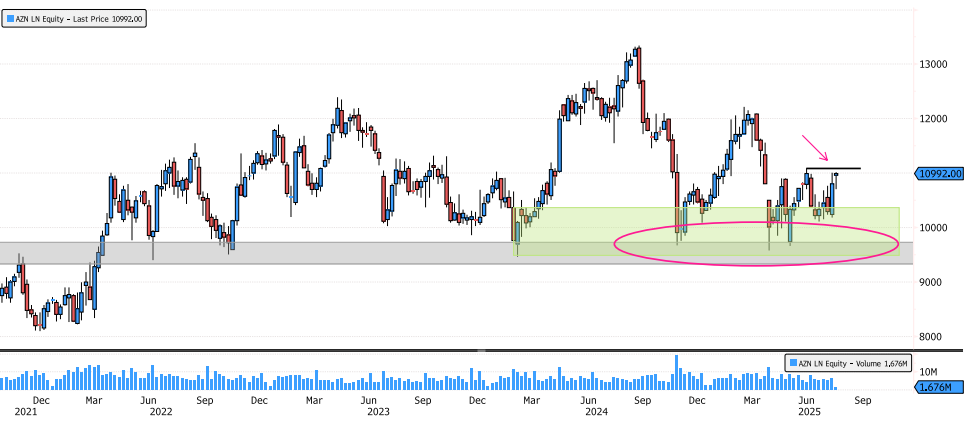
AstraZeneca Trying to Breakout
After several months of rebounding from the major support zone between 9330-9730, AstraZeneca is now showing signs of a potential breakout. Keep an eye on the 11086 resistance for any confirmation of the breakout. Source: Bloomberg
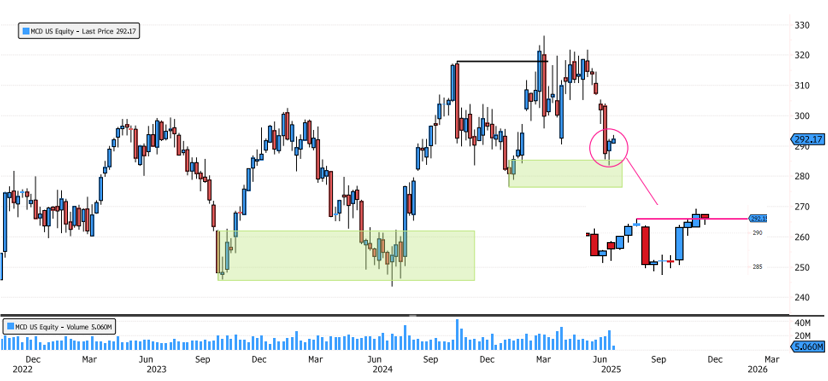
McDonald's Reacting on Major Swing Support
McDonald's (MCD) has consolidated 13% since the highs and is now back on the major swing support zone between 276-286. Yesterday, we saw some positive price action on the 4-hour chart, indicating a potential short-term trend change. Keep an eye on the price action over the next few days for further developments. Source: Bloomberg
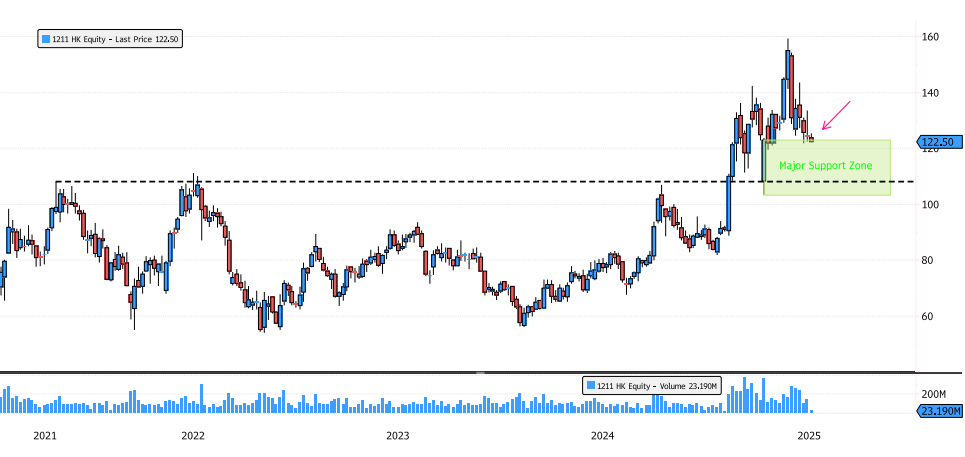
BYD Entering Major Support Zone
Since the May high, BYD (1211 HK) has consolidated more than 20%! The stock is now entering a major support zone between 103-123. Additionally, BYD is back at the 61.8% Fibonacci retracement, which places it in the discount zone. Keep an eye on the price action over the next few days for potential developments. Source: Bloomberg