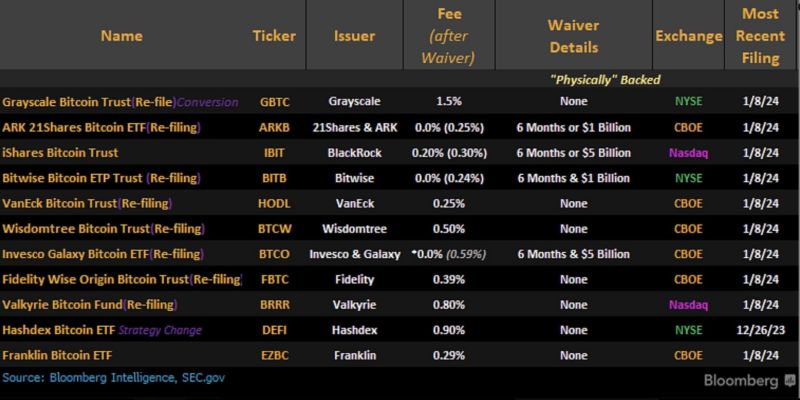
BREAKING bitcoin spot ETF: the fee war has begun
Bitcoin ETF applicants are filing last-minute amendments to lower their fees 👀 BlackRock's lowered to 0.30% 👀 ARK lowered lowered to 0.25% 👀 Wall Street is competing to offer cheap access to $BTC... Source: The Kobeissi Letter, Bitcoin Magazine
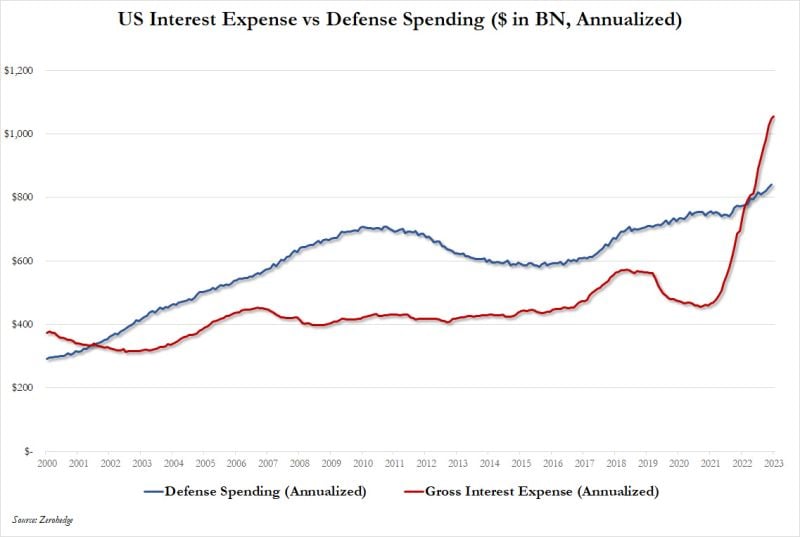
US defense spending vs interest on Federal debt
Source: www.zerohedge.com
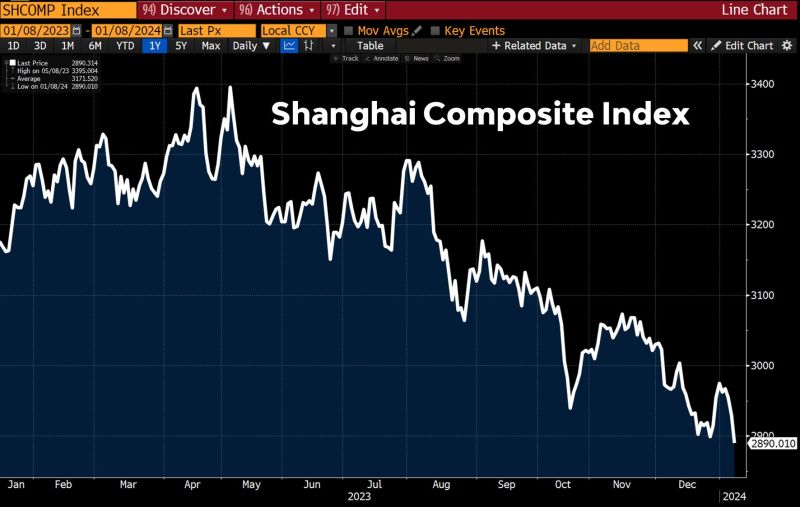
New Year, New Low!
After a shallow rally, Chinese hashtag#equities just made a new low. Down 15% from their peak in May last year, down 22% from their 2021 peak. Sources: Jeroen Blokland, Bloomberg
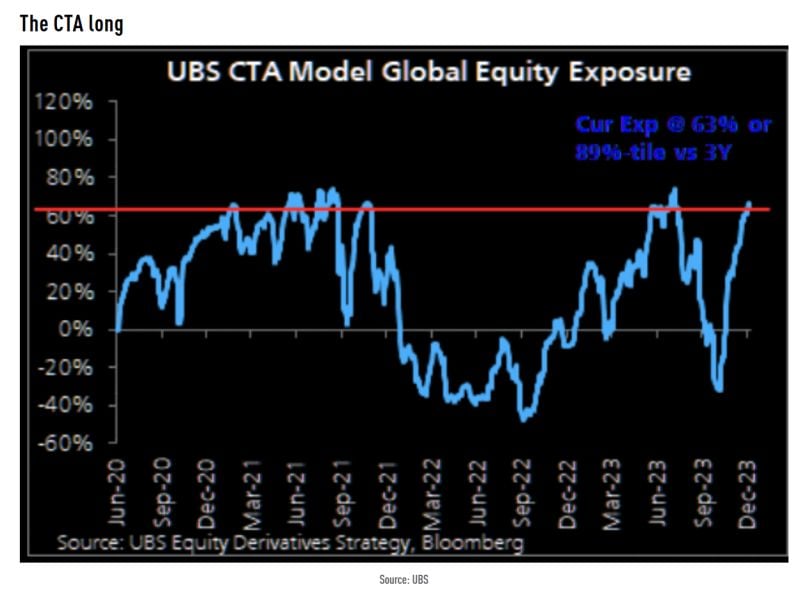
Long positioning by CTAs is extreme and creates some downside risk for the market.
According to UBS: "ES1 (sp500 futures) is already 100% long with first meaningful sell triggers @ -4% to -6%. NQ1 (nasdaq) is 92% long with first meaningful sell triggers @ - 4% to 6%". Source: TME, UBS
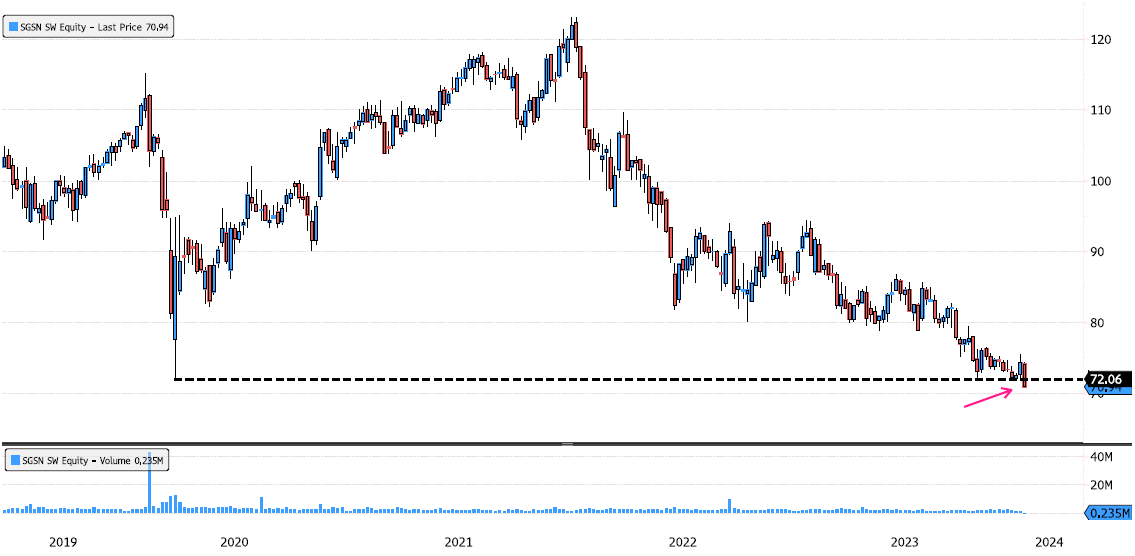
SGS under pressure, on long term swing support
SGS (SGSN SW) is down more than 5% this morning and 43% since January 2022 highs ! Keep an eye at 72.06 support over the next few days. Source : Bloomberg
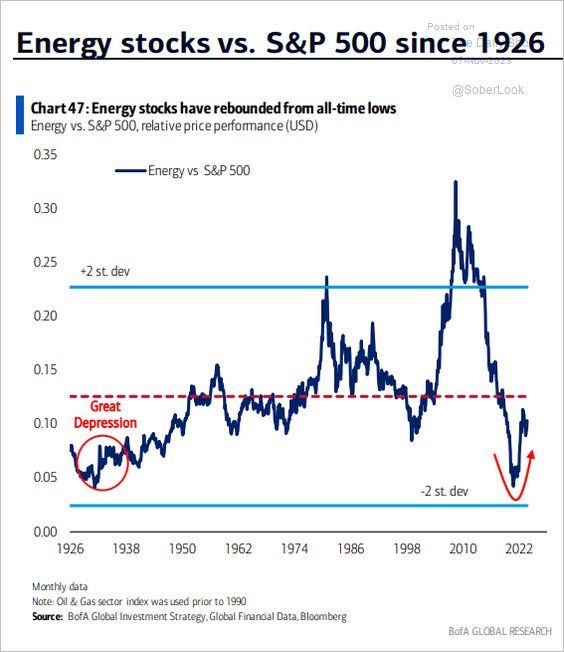
ENERGY STOCKS SINCE 1926 (relative to S&P)
Source: BofA, The Daily Shot
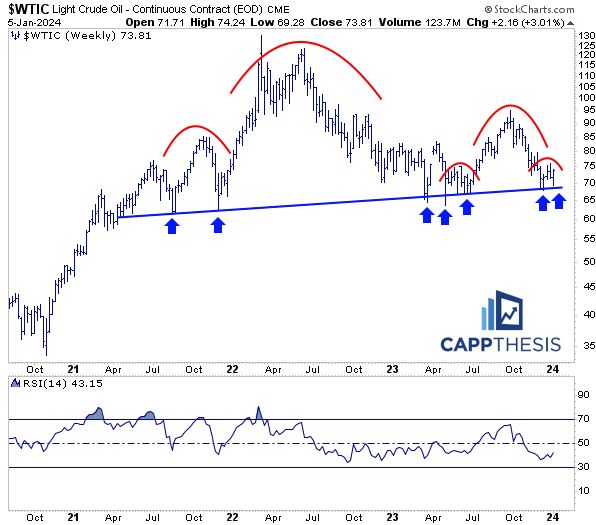
A topping pattern on crudeoil? Or simply finding support at a long-term trendline before a move higher? This one needs to be watched closely
A great chart from Frank Cappelleri thru Ryan Detrick, CMT.
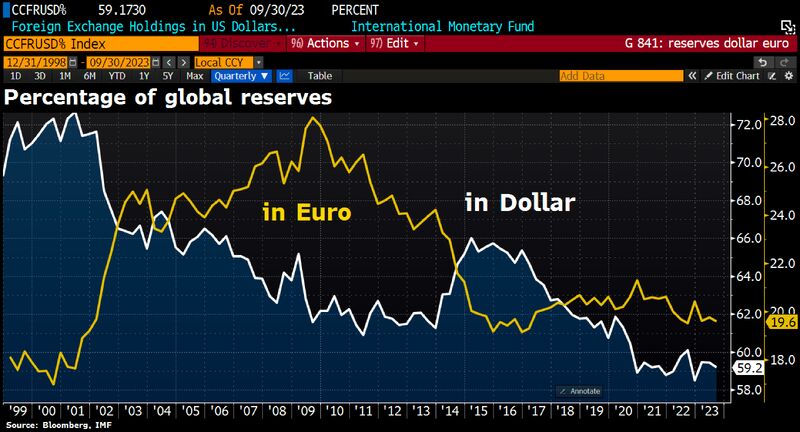
The "multipolar world" will remain a major topic in 2024 as the rewiring of the global commerce system creates geopolitical risks & business model shifts that will last decades
The Dollar’s & Euro's share in global CenBank reserves dropped. Greenback accounted for 59.2% of globally allocated FX reserves in Q3 2023, down from a revised 59.4% in Q2, lowest since Q4 2022. Euro’s share in reserves also fell to 19.6% from 19.7%, while the participation of Japan's Yen rose to 5.5% from 5.3%. Source: HolgerZ, Bloomberg