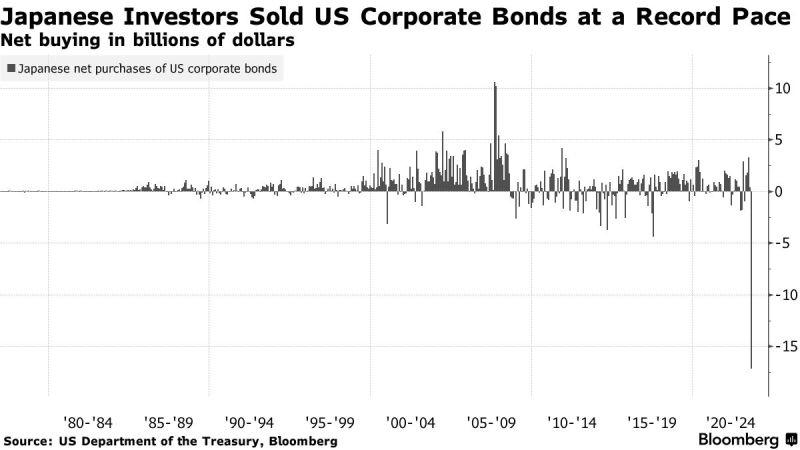
Japanese investors are selling US corporate debt at a record pace 👀
Source: Bloomberg
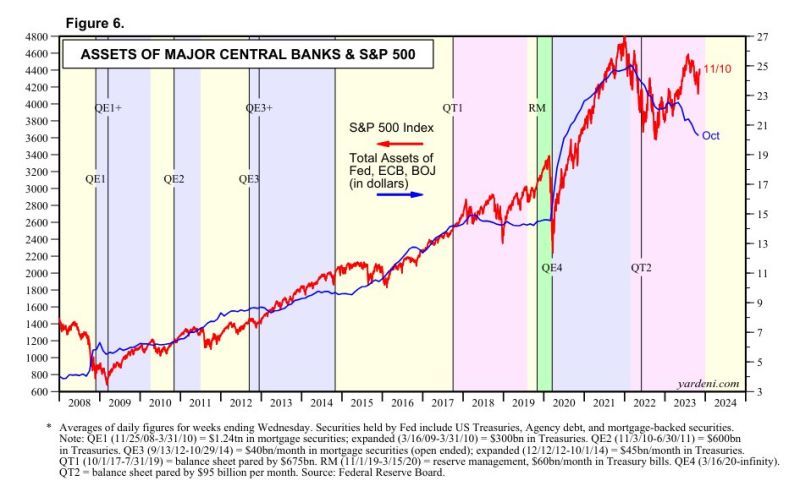
Central bank liquidity and the Sp500 are experiencing a rather large divergence. Will it matter?
Source: Markets & Mayhem
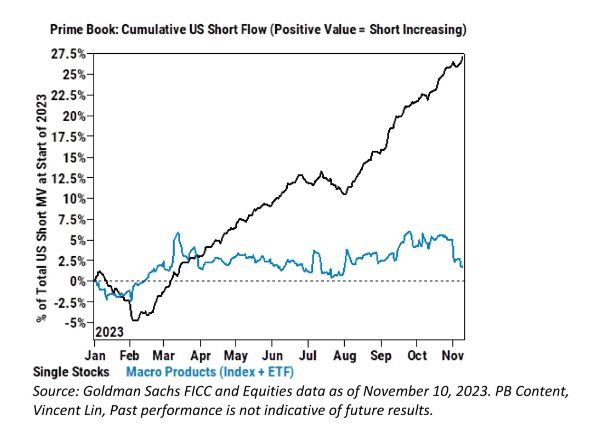
Hedge Funds have increased their short stock positions for 14 consecutive weeks, the longest streak in history
Source: Win Smart, Goldman
As highlighted by Linas Beliūnas, Magazine cover pages can be good contrarian indicators...
Last week, Sam Bankman-Fried found guilty on all 7 charges, faces up to 115 years in prison while WeWork filed for bankruptcy marking one of the biggest start-up failures of all time.

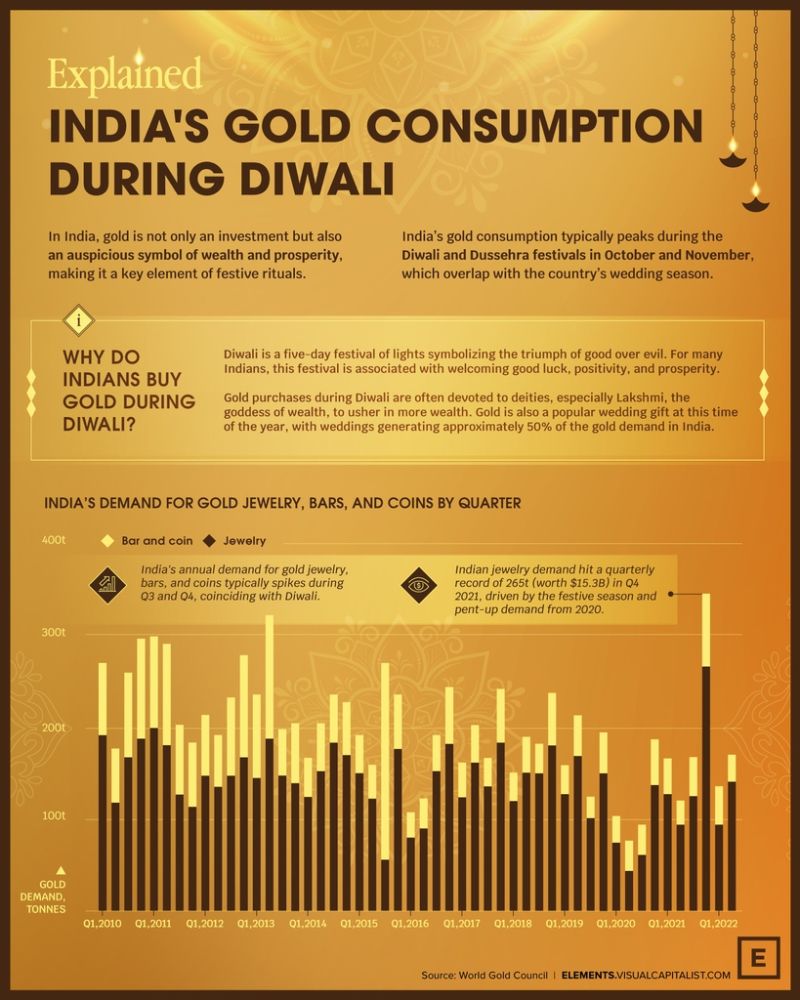
Explained: India’s Gold Demand During Diwali - by Elements, Visual Capitalist
In India, gold’s significance goes far beyond investment and jewelry. The yellow metal is woven into India’s cultural history and is revered by a population of over 1.3 billion.
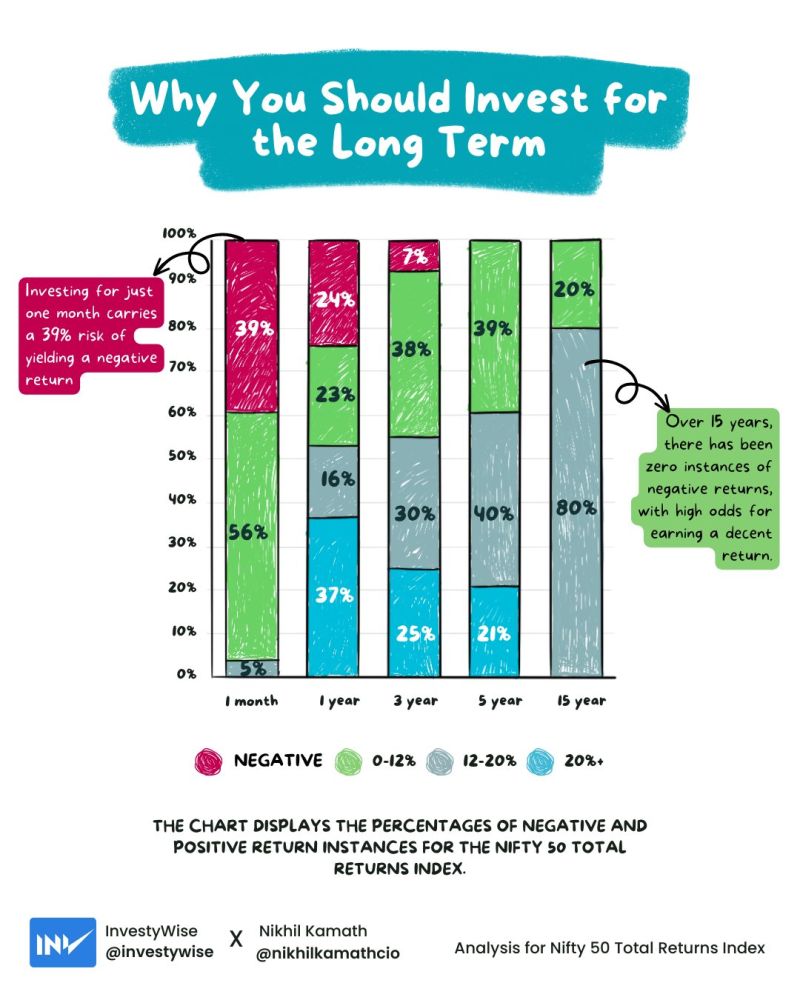
Why you should invest for the long run - Nikhil Kamath / InvestyWise Nikhil Kamath
(Stats are for Indian hashtag#stocks but the principle remains the same for most equity markets in the world) "Someone's sitting in the shade today because someone planted a tree a long time ago." - Warren Buffet
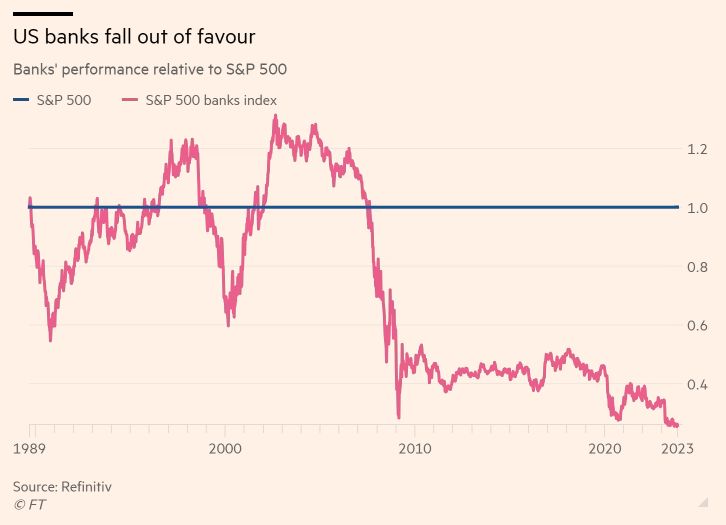
U.S. Banks have fallen to an all-time low against the S&P 500
Source: FT, Barchart
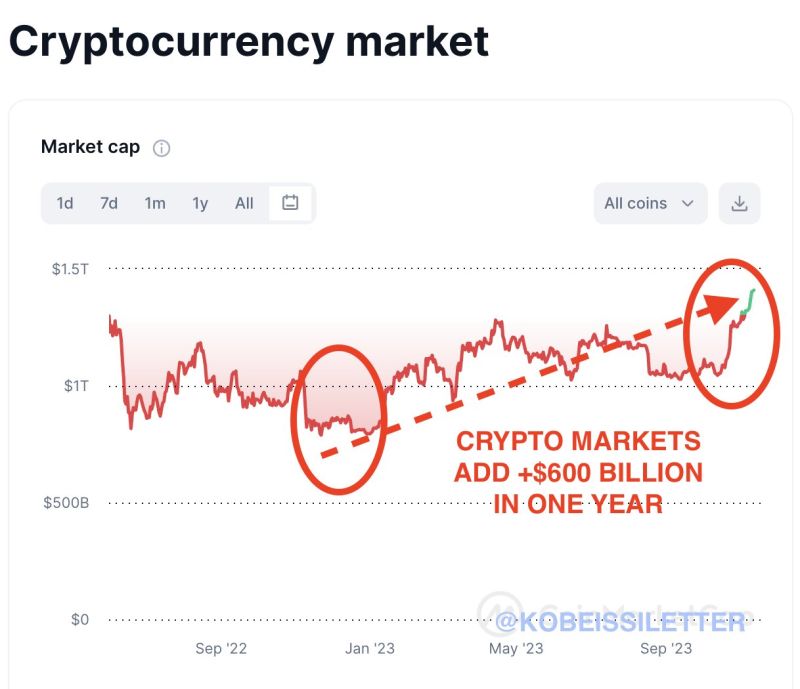
For the first time in years, crypto markets are beginning to see tons of new liquidity
Since November 2022, crypto markets have added $600 billion in value. That's a +75% jump in one year while Bitcoin is up +120% over the last year. This comes after years of consistent outflows from crypto markets. Source: The Kobeissi Letter