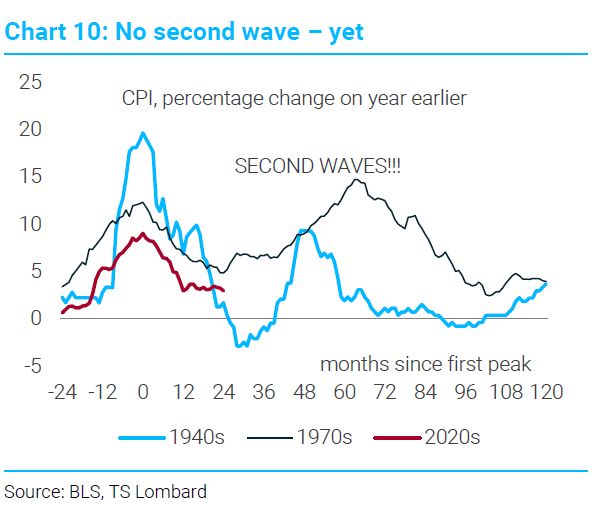
After yesterday jumbo Fed rate cut (days after core CPI MoM reaccelerarting), who doesn't have this chart in mind???
The Second Wave of Inflation. This is what the Fed is thinking but isn't saying out loud. If you expand the dataset to the CPI's of Western economies, 87% of the time there's a second wave. Source. TS Lombard, Eric Hale
The bulls are running WILD pre-market. Thank you Mr Powell...
$DIA +1.18% $SPY +1.61% $QQQ +2.18%

FED cuts rates by 50bp to 4.75%-5% range
The Federal Reserve lowered its benchmark interest rate by a half percentage point Wednesday, in an aggressive start to a policy shift aimed at bolstering the US labor market.Committee sees another half-point of cuts in rest of 2024Policymakers penciled in an additional percentage point of cuts in 2025, according to their median forecast.
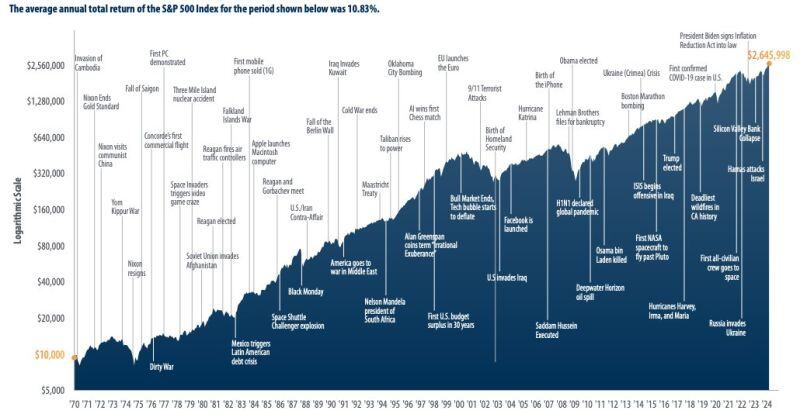
Regardless of what is happening in the world, or who happens to be President, the market finds a way forward.
Source: Peter Mallouk
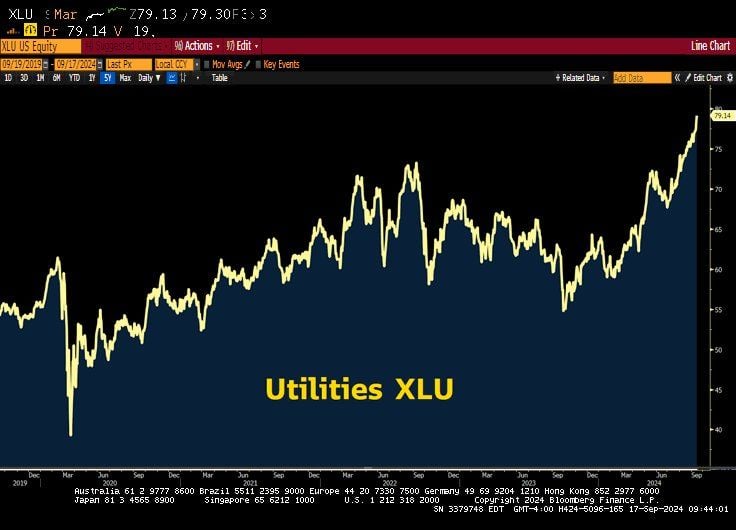
Utilities Destroying Mag 7 in 2024?
Utilities $XLU +27% Amazon $AMZN +21% QQQ +16% Microsoft $MSFT +15% Apple $AAPL +13% Google $GOOGL +13% Tesla $TSLA -9% Source: Lawrence McDonald @Convertbond, Bloomberg
BlackRock is preparing to launch a more than $30bn artificial intelligence investment fund
With technology giant Microsoft to build data centres and energy projects to meet growing demands stemming from AI, people briefed about the matter said https://on.ft.com/3Bh2aGG Source: FT
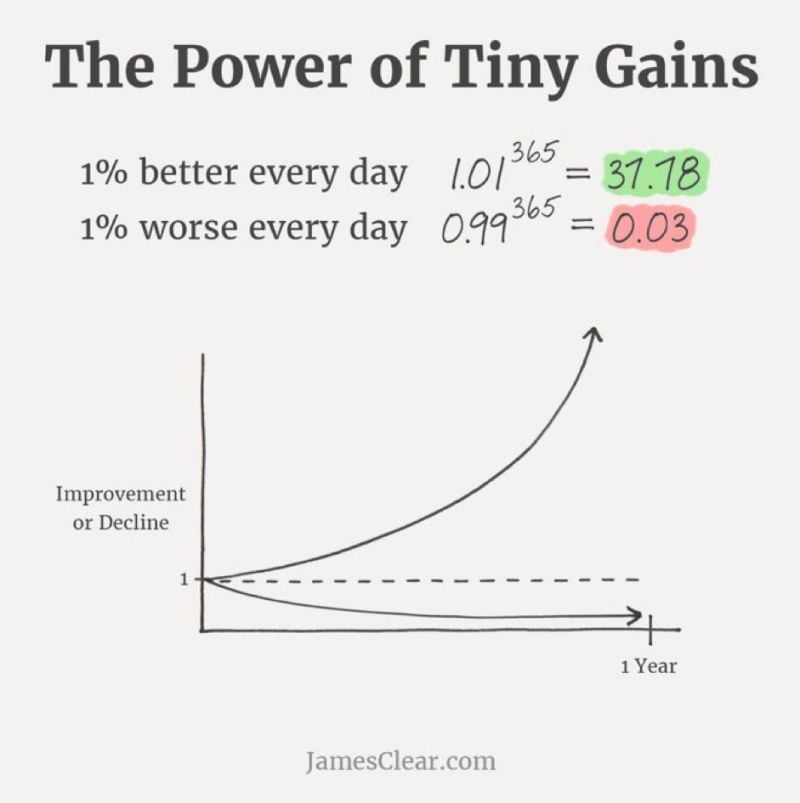
The power of tiny gains
Source: Invest in Assets
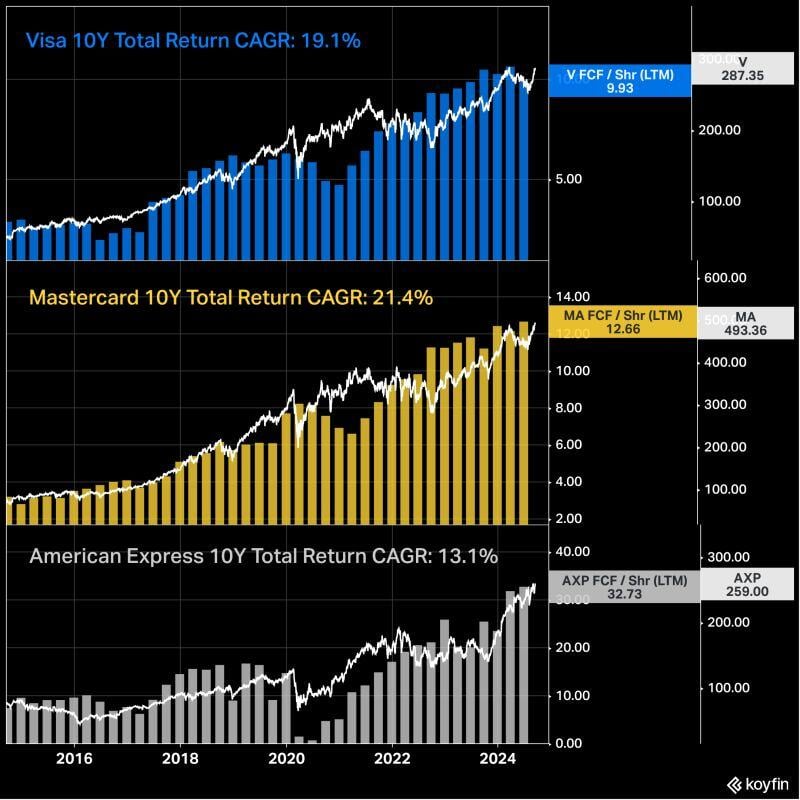
Visa, Mastercard, and American Express' FCF per share and share price over the last decade.
10Y Total Return CAGR: $V Visa: 19.1% $MA Mastercard: 21.4% $AXP American Express: 13.1% Source: @KoyfinCharts