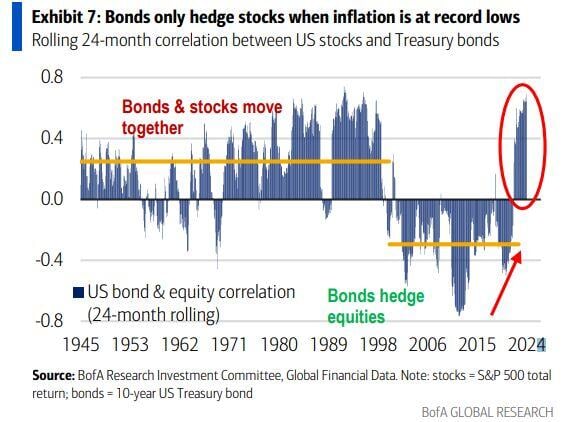
Historically, bonds acted as efficient portfolio hedges only when inflation is <2%.
Below is the rolling 24-month correlation between US stocks and Treasury bonds. Source: Mike Zaccardi
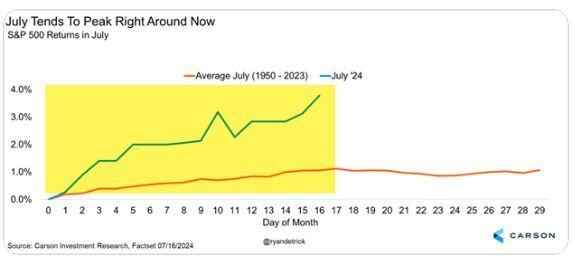
July has been up 9 years in a row and the first half of July is one of the strongest periods of the year.
This strength shouldn't be too surprising. But be aware historically July peaks on the 17th, so tomorrow. Source: Ryan Detrick
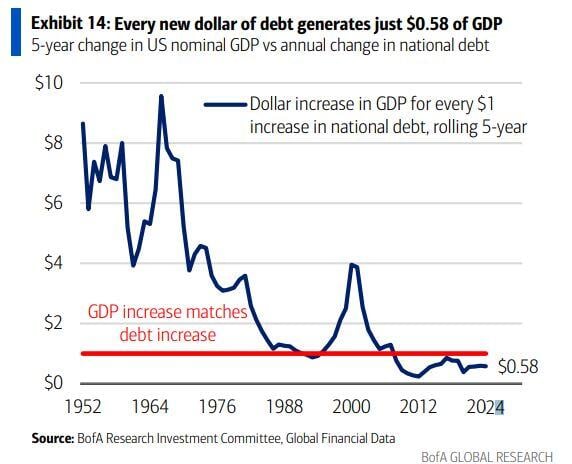
Unproductive debt...
Every new dollar of US debt generates just $0.58 of GDP Source: Mike Zaccardi, BofA
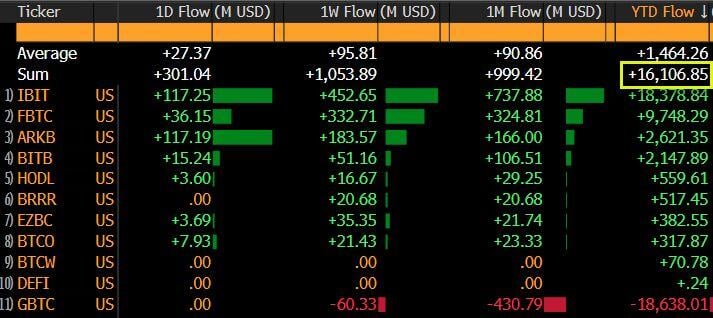
NEW:US Spot Bitcoin ETFs hit $16 billion inflows 🚀
Source: Bitcoin Magazine
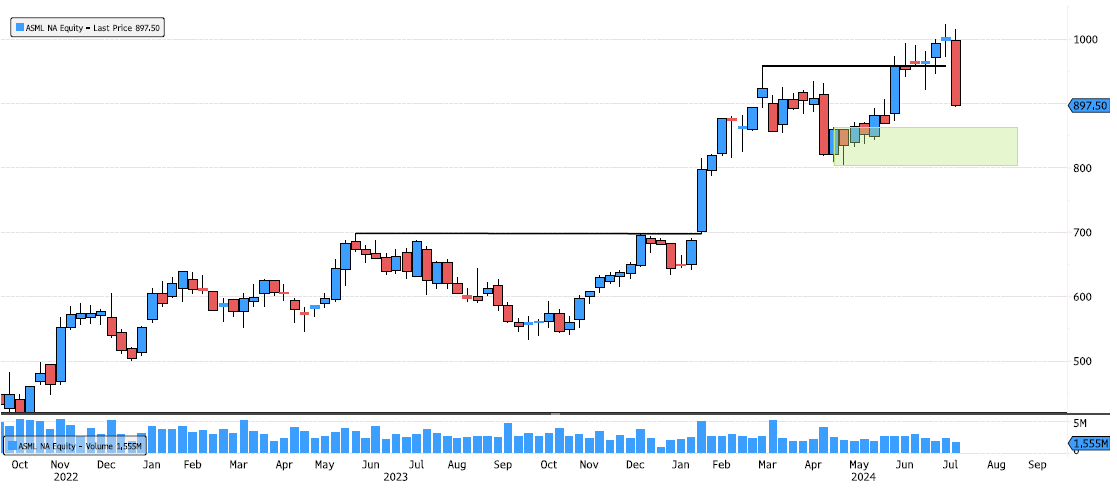
ASML Trying to Find Support
ASML is under pressure today, down 8% due to earnings. The next major support zone to keep an eye on is between 804-862. Source: Bloomberg
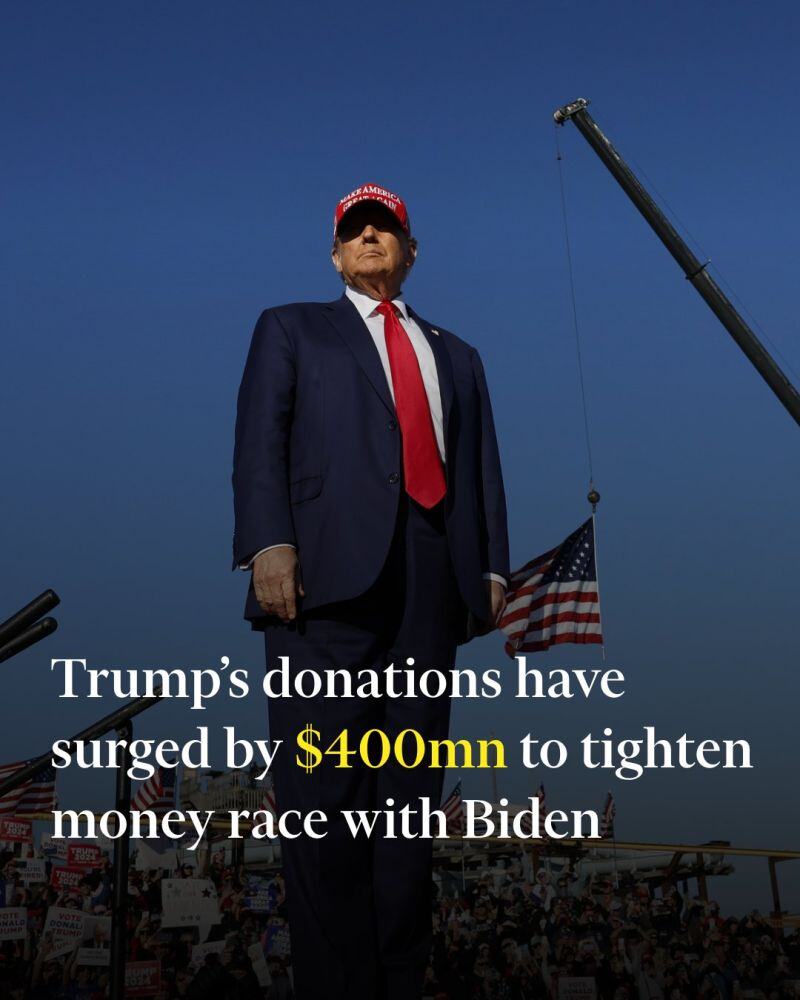
The amount raised by the former president is a record second-quarter haul that almost matches the sums raised during his entire 2016 campaign, according to an analysis of federal filings
Fundraising groups aligned with Donald Trump raised more than $400mn for his presidential election campaign between April and June — a record second-quarter haul that almost matches the sums raised during his entire 2016 campaign, according to a Financial Times analysis of federal filings. The figure, which is likely to grow as more of the political action committees that help fund campaigns report this weekend, is three times the first-quarter total and roughly double their contributions from the same period of the 2020 election. The massive windfall, which puts the Republican on track to outpace his Democratic rival President Joe Biden, came from small donors furious at Trump’s criminal conviction in New York and billionaires flocking to his campaign. Source: FT Link >>> https://lnkd.in/eijfGTMR
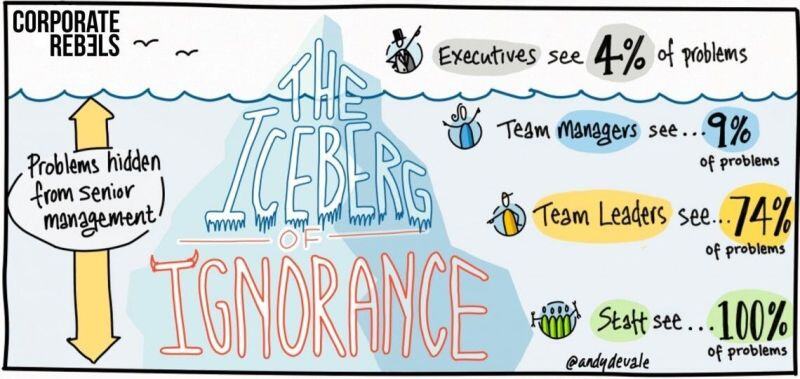
As highlighted by Corporate Rebels >>> In most traditional organizations, managers see only the tip of the iceberg – just a fraction of the issues.
According to Sidney Yoshida, only 4% of problems are known to executives. Being able to "fill thef gap" is key. And this is where smaller and more nimble structure can make a difference.
Speakers at the Bitcoin 2024 Conference in Nashville US
- Donald Trump - Robert F. Kennedy Jr. - Cathie Wood - Michael Saylor - Edward Snowden - Vivek Ramaswamy Source: Bitcoin Magazine