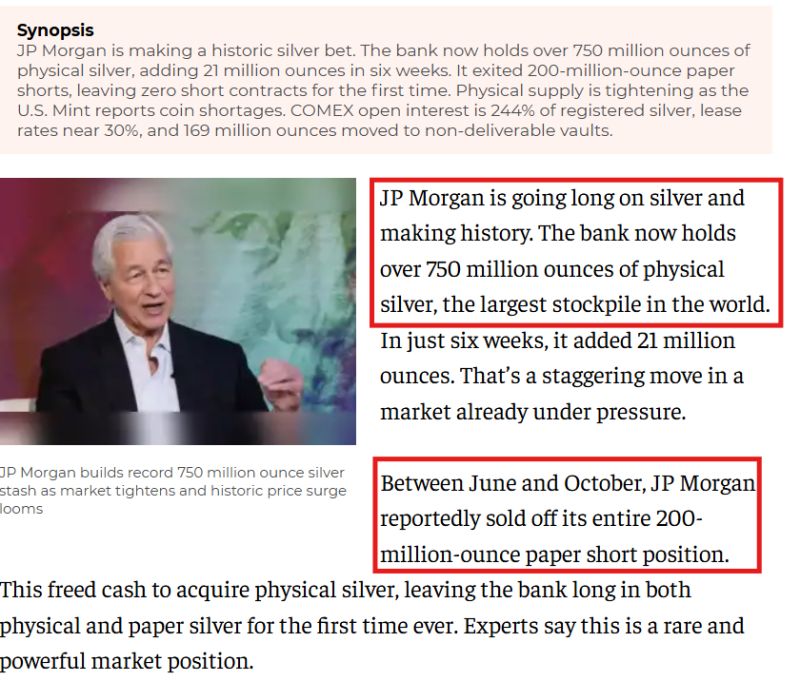
🚨SEISMIC FOR SILVER 🚨
Reports on X and Economic Times of India are emerging that JP Morgan is positioning itself with a historic PHYSICAL SILVER STOCKPILE. If true this is a major event for silver The Economic Times of India : "JP Morgan is going long on silver and making history. The bank now holds over 750 million ounces of physical silver, the largest stockpile in the world. In just six weeks, it added 21 million ounces. That’s a staggering move in a market already under pressure. Between June and October, JP Morgan reportedly sold off its entire 200-million-ounce paper short position. This freed cash to acquire physical silver, leaving the bank long in both physical and paper silver for the first time ever. Experts say this is a rare and powerful market position. The move coincided with the U.S. Mint announcing a shortage of silver coins. Physical supply is tightening while demand is rising. JP Morgan is holding real silver, not paper contracts. This is a key difference from the Hunt brothers’ attempt to corner silver in 1980. Back then, reliance on paper contracts led to intervention and collapse. JP Morgan’s approach reduces risk of regulatory disruption. Source: Economic Times of India, Silvertrade
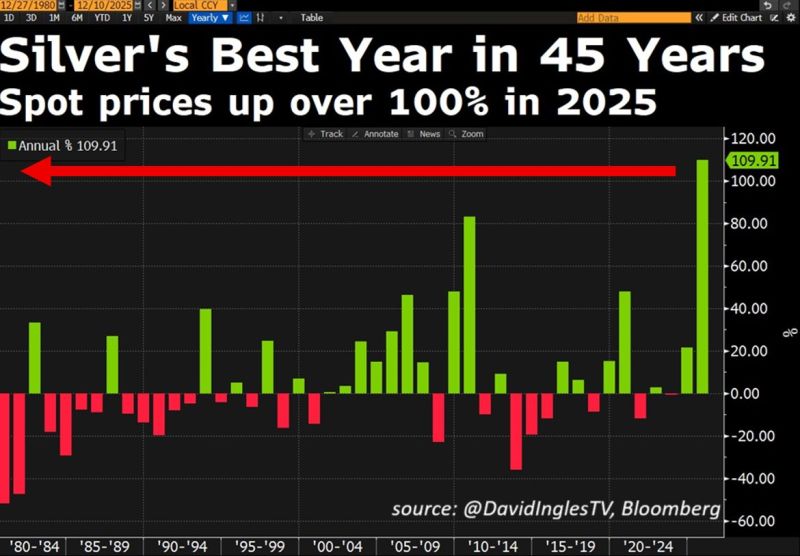
🚨 SILVER SHOCKWAVE: WHY THE GREY METAL IS EXPLODING TO RECORD HIGHS! 🚀💰
Silver is trading above $61 for the first time in history, tracking a colossal +110% gain in 2025—the second-best year on record! 💥 THE 8 FORCES DRIVING THIS PARABOLIC MOVE: CHINA SUPPLY COLLAPSE: SHFE inventories are at a 9-year LOW! Massive exports are draining the world's key bullion hubs. LONDON LIQUIDITY CRISIS: Even with record inflows, market liquidity is strained, and borrowing costs are stubbornly ELEVATED. TRUMP TARIFF SCARE: Traders pulled huge quantities into the US on anticipation of potential tariffs, tightening the London market even more. INDIA'S APPETITE: Accelerating demand from one of the world's largest consumers is intensifying the squeeze. RETAIL RUSH: ETF inflows are heading for their 10th positive month, and call options on the largest silver ETF are SPIKING. The crowd is piling in! FED RATE CUT BETS: Falling borrowing costs make non-yielding assets like silver IRRESISTIBLE compared to cash and bonds. SOLAR BOOM: Rising industrial demand, especially from photovoltaic installations (peak season!), is consuming physical metal at an alarming rate. CHINA TAX SHIFT: Tax changes on gold pushed investors directly into silver's welcoming arms. Meanwhile, the Gold-to-Silver Ratio is plummeting to 2021 lows. Source: Global Markets Investor, David Ingles, Bloomberg
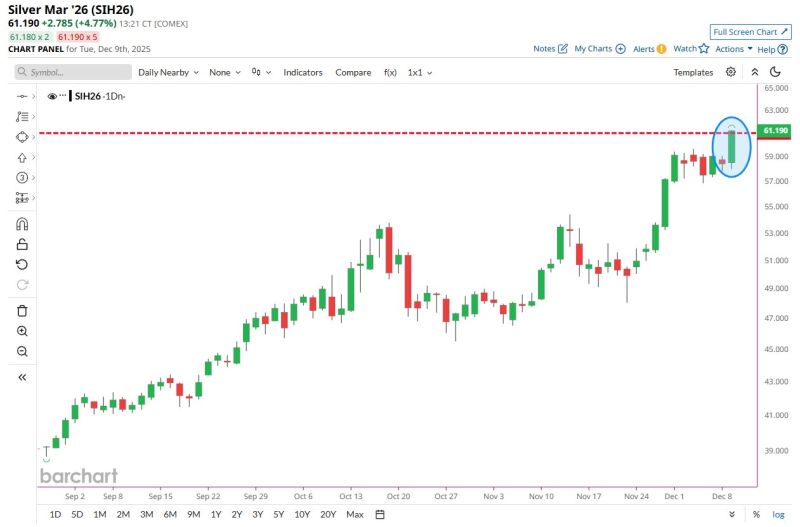
Silver soars to $61 for the first time in history 📈🚀
Source: Barchart
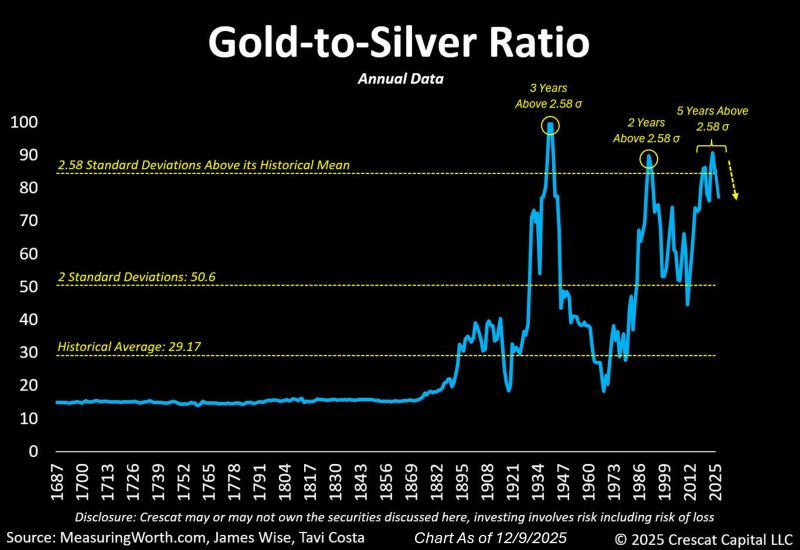
The gold-to-silver ratio is starting to move abruptly, as it often does after reaching extremely elevated levels.
Source: Tavi Costa
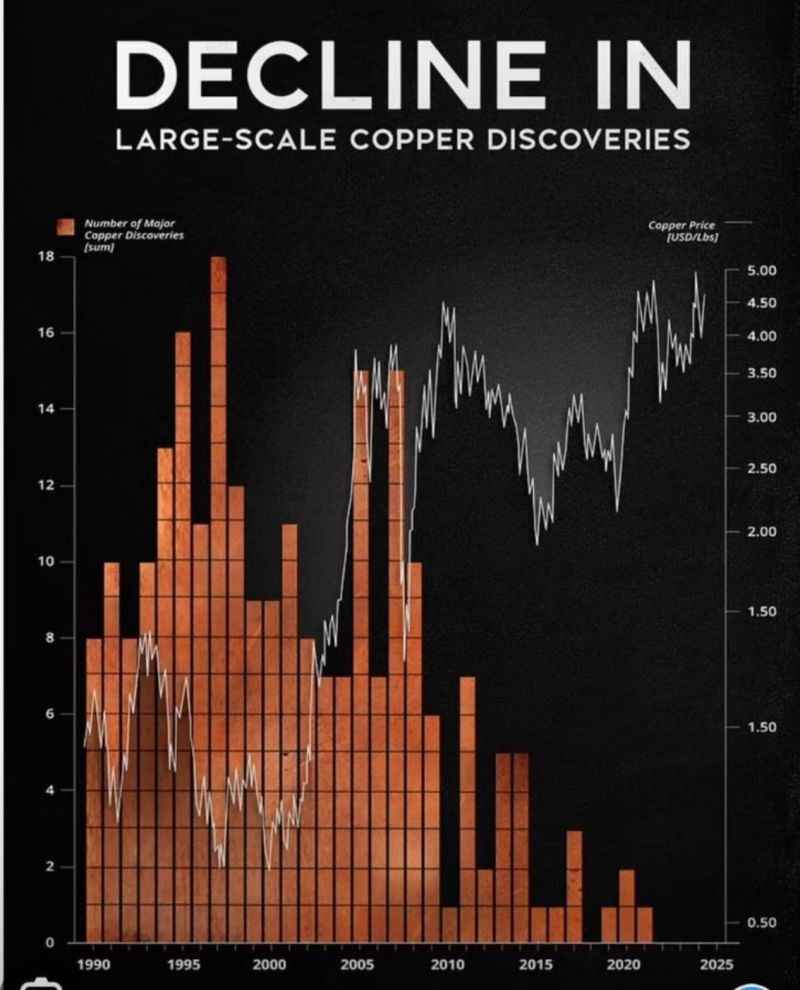
You can’t electrify the world without copper and the world is running out of it.
- Large-scale copper discoveries are down 90% over the last two decades - Copper deficits are projected to widen through 2030 - Copper demand is surging: driven by electrification, data centers, and AI - It takes 20+ years from discovery to first production How far can this copper bull market run? Source: Lukas Ekwueme @ekwufinance
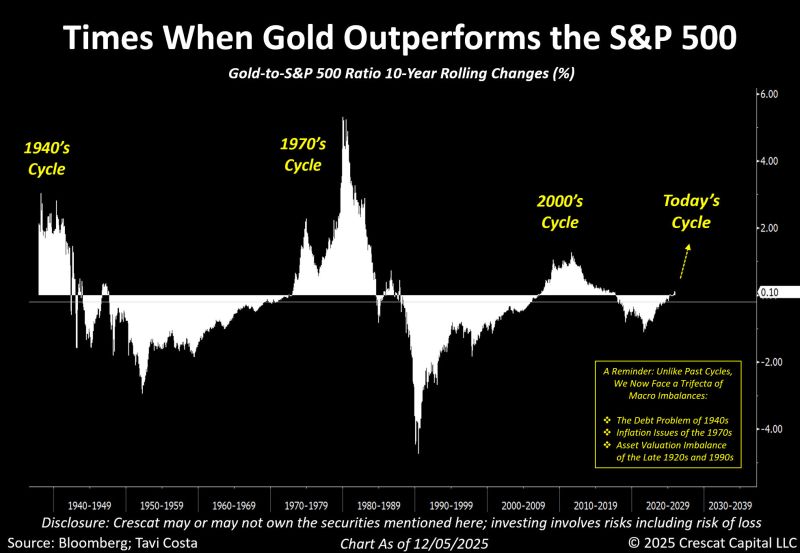
Gold relative to S&P 500: are we just at the start of the cycle?
A fascinating chart by Otavio (Tavi) Costa Gold relative performance dynamic follows very long-term cycles, and we’re likely only in the early stages of this one. As Tavi points out, we now face a trifecta of macro imbalances: ▪️The Debt Problem of the 1940s ▪️Inflation Issues of the 1970s ▪️Asset Valuation Imbalance of the Late 1920s and 1990s Source: Bloomberg, Crescat Capital
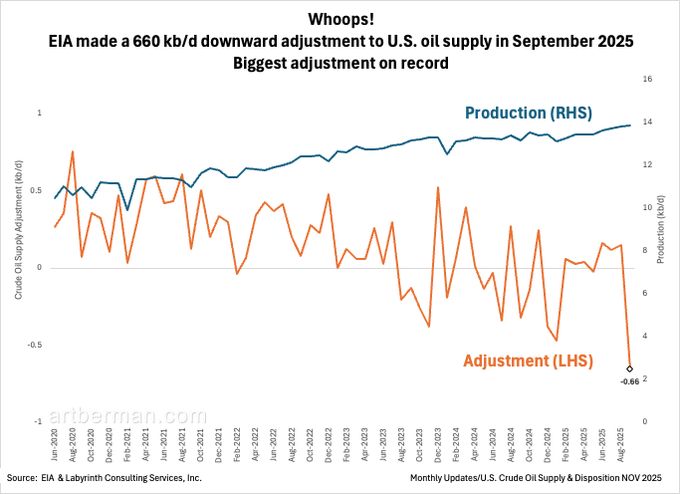
The IEA’s “historic oil glut” narrative is collapsing in real time.
US production, the foundation of their entire forecast, has now been quietly revised downward. And not by a small amount. This is the largest US supply revision in the IEA’s entire history. 660,000 kbpd just for the month of September The reason: - US shale, the only global source of meaningful growth for 15 years, is peaking. - Tier 1 acreage is drilled out - Gas-to-oil ratios are exploding - Water cuts are rising across every major basin - Decline rates are accelerating as sweet spots exhaust Shale’s boom phase gave the world a decade of easy barrels, masking the fact that the rest of the world wasn’t investing. Its bust phase will do the opposite... leave a supply hole the world cannot fill in the short term.
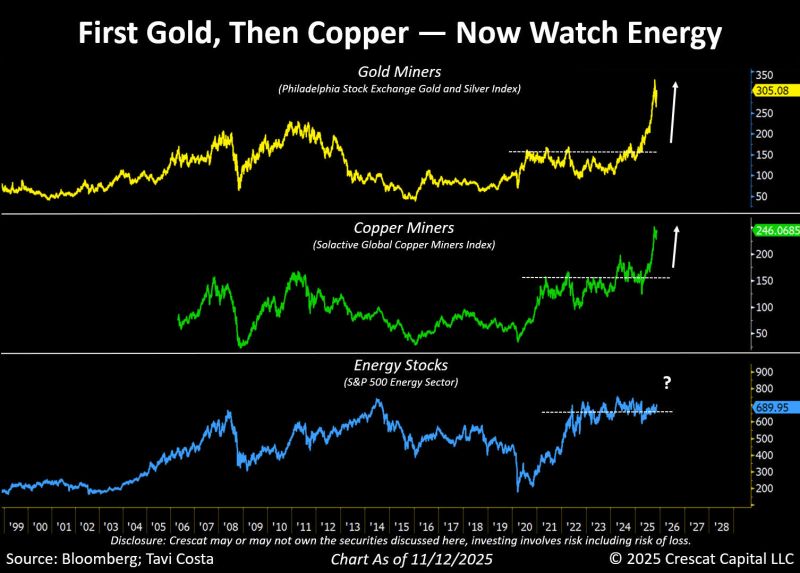
Otavio (Tavi) Costa just made a case for energy stocks, which have been quietly inching higher.
Here's his view: ▪️Positioning remains deeply bearish. ▪️U.S. oil and gas rigs are contracting meaningfully. ▪️Oil is trading near one of the cheapest levels in history relative to the money supply. ▪️Energy’s weight in the S&P 500 is hovering near record lows. He sees energy equities as one of the most fundamentally attractive corners of the market right now. Your thoughts? Source: Tavi Costa, Crescat Capital, Bloomberg