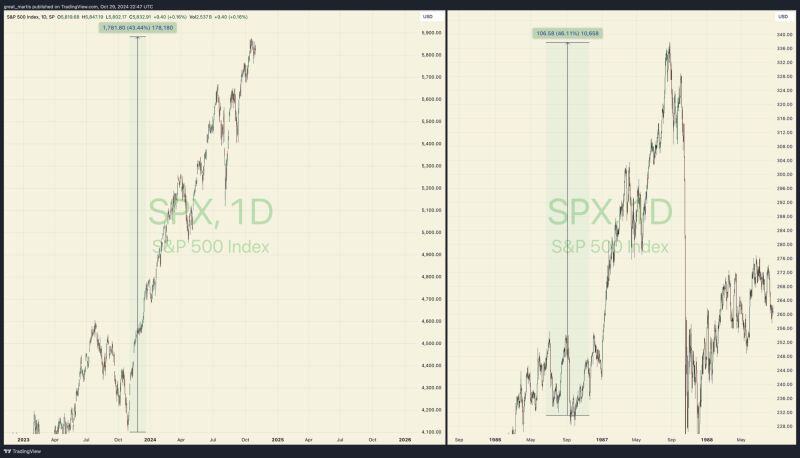
The last time the S&P 500 rose more than 40% over 12 months was in 1987.
Source: The Great Martis @great_martis
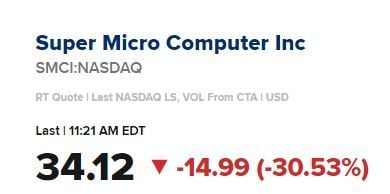
👎 BIG BREAKING >>> Super Micro Computer stock, $SMCI, falls 27% after Ernst & Young announces they refuse to audit the company going forward.
EY is "unwilling to be associated with the financial statements prepared by management," the statement said. 🚨 $SMCI stock is imploding Source: CNBC
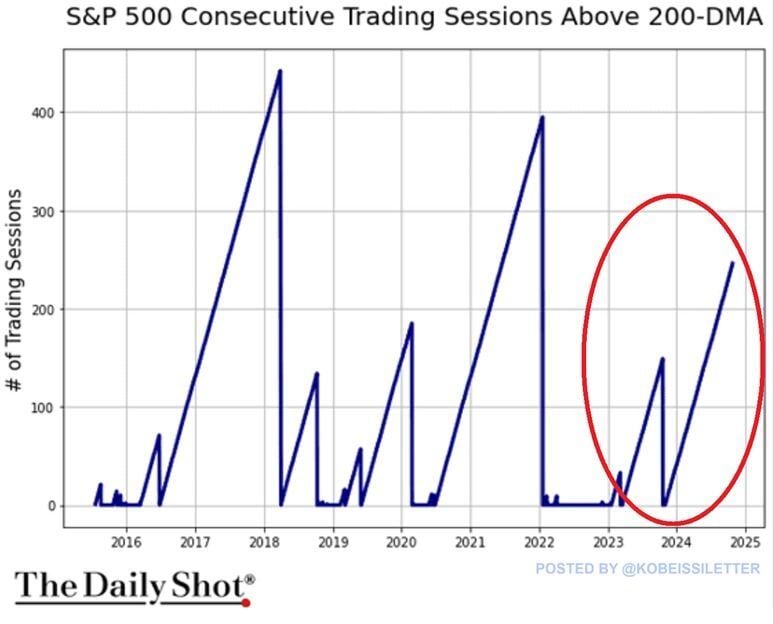
This is one of the most resilient stock market in history:
The S&P 500 has been trading above its 200-day moving average for 247 straight sessions, the third-longest streak in 8 years. The previous 2 records were posted in 2016-2018 and 2020-2021 which lasted for 430 and 400 trading days, respectively. Over the last 12 months, the S&P 500 is now up over 40%, marking the 4th best 12-month performance this century. There have been only three other occurrences since 2000 when the index rallied at least 39% year-over-year: 2004, 2010, and 2021. To put this into perspective, the S&P 500's average annual return since 1957 has been ~10%. Source: The Kobeissi Letter, The Daily Shot
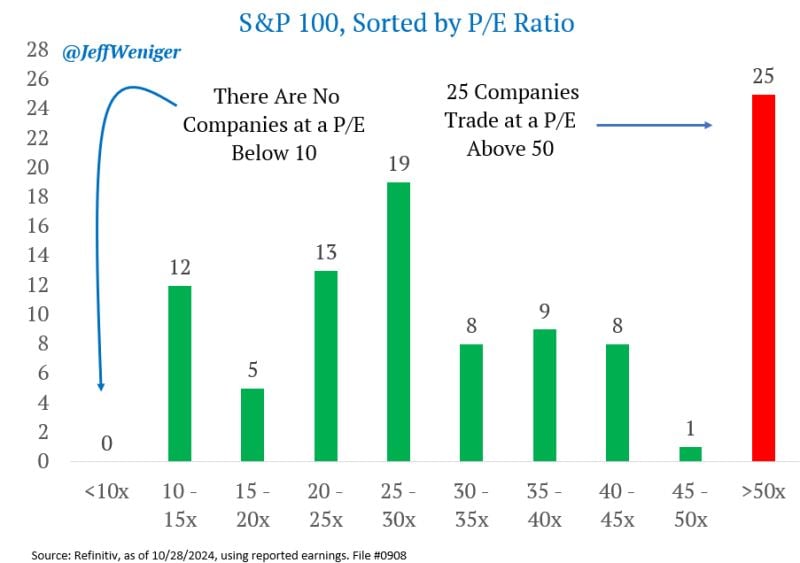
Of the 100 largest companies (the S&P 100), there are 25 who are trading for more than 50x reported earnings.
Meantime, there are zero companies trading for less than 10x earnings. Source: Jeff Weniger
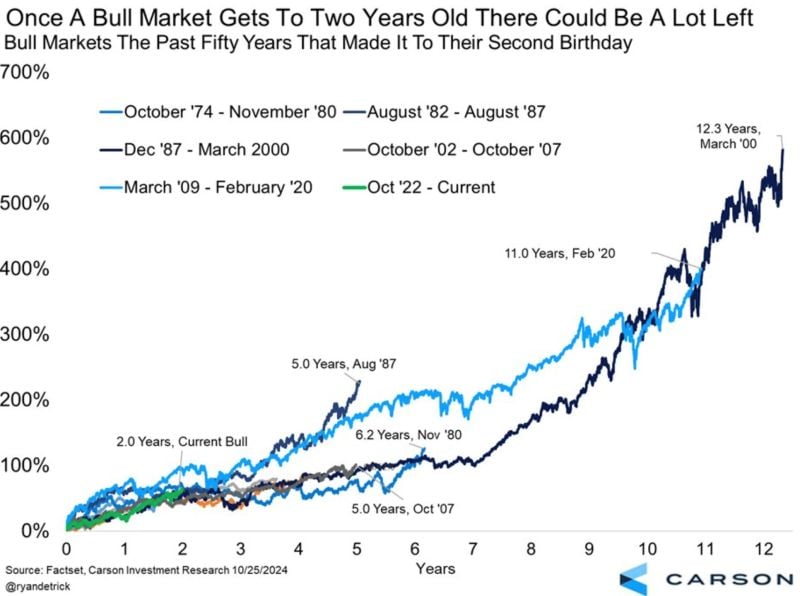
US equities Bull markets go on longer than many of us think they will.
Source: Carson, RBC
An image is worth 10,000 words...
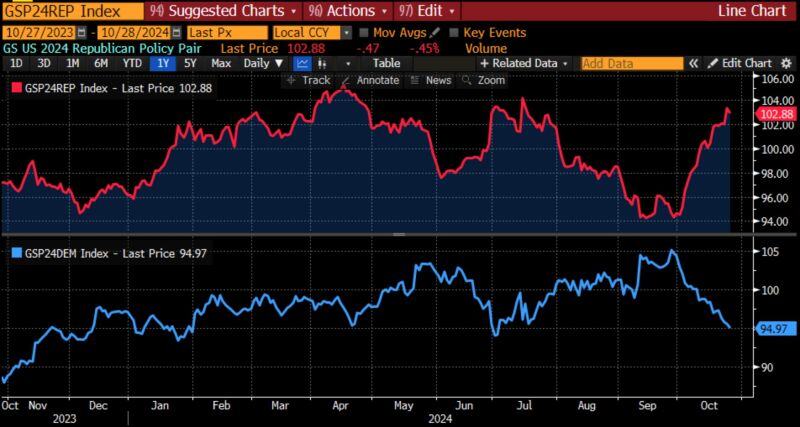
The Trump trade visual (Republican basket index in red, Democrats basket in blue) Source: Bloomberg, GS, RBC
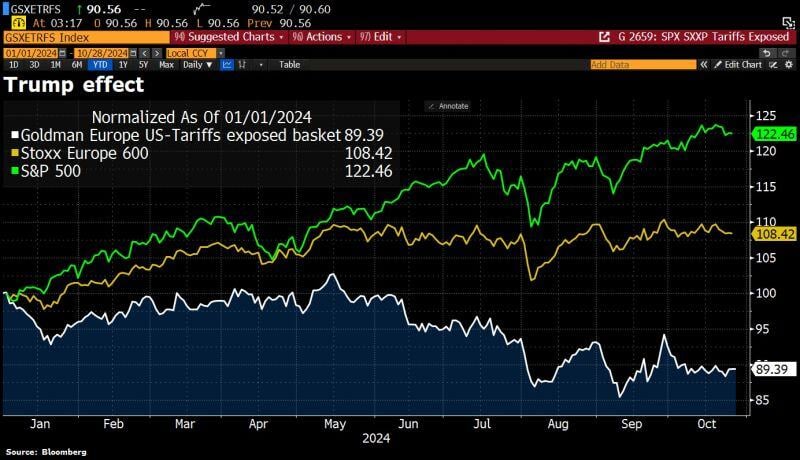
European stocks are hit by a ‘Trump effect’ as odds tilt towards Republican win.
A basket of 22 European stocks exposed to US tariffs compiled by Goldman Sachs has tumbled 5% since late September as the former president’s odds of an election victory shorten. The basket, which includes Diageo, Porsche, Mercedes, Adidas or Moller Maersk is now down 11% this year, compared with an 8% rise for the broader European stock market and 22.5% for the S&P500. Source: HolgerZ, Bloomberg
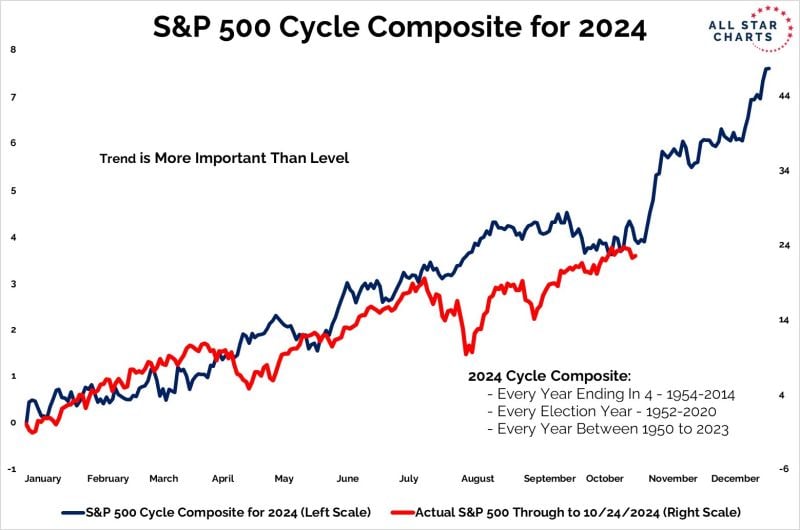
As the market has now fully priced in a second trump presidency, the S&P500 is about to enter the best 3 month period of the year: November - January.
Below is the cycle composite for the SP500... (The trend is more important than the level). Source: J-C Parets