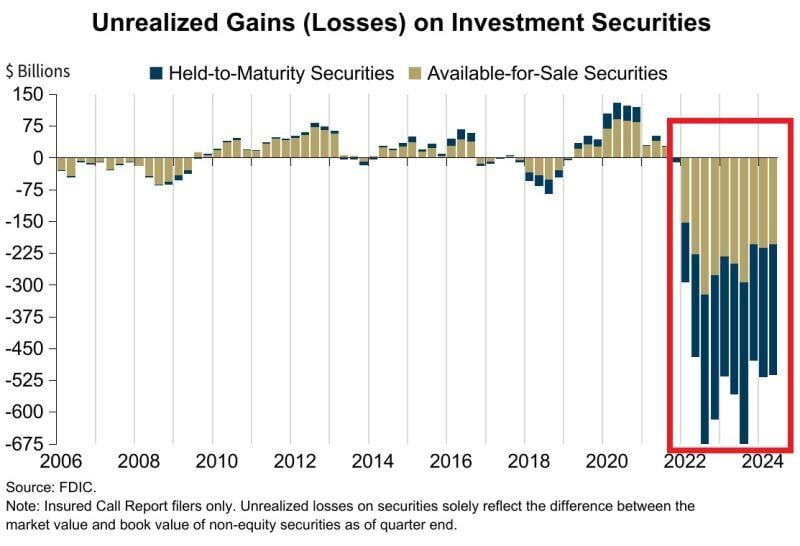
⚠️US BANKS UNREALIZED LOSSES HIT $512.9 BILLION IN Q2 2024⚠️
Q2 marks the 11th STRAIGHT quarter of unrealized losses on investment securities for banks, a streak never seen before. The number of banks on the FDIC Problem Bank List increased to 66 and represents 1.5% of total. Source: Global Markets Investor
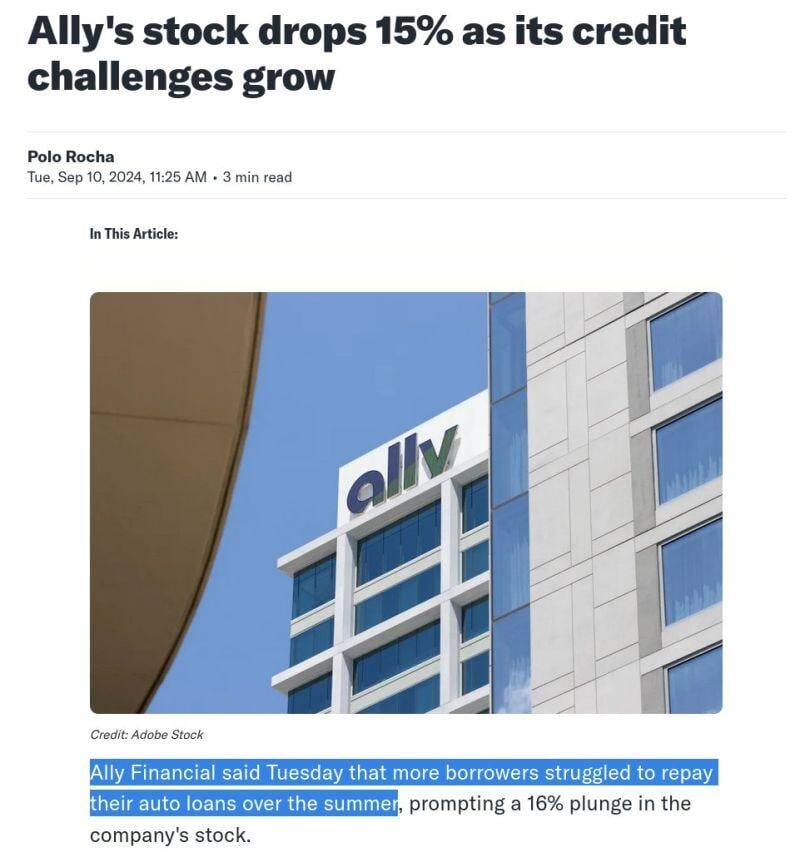
$ALLY tumbled 17.5% yesterday as auto loan repayments see rising delinquency rates spook investors
More evidence that a growing portion of consumers are increasingly struggling. Source: Markets & Mayhem
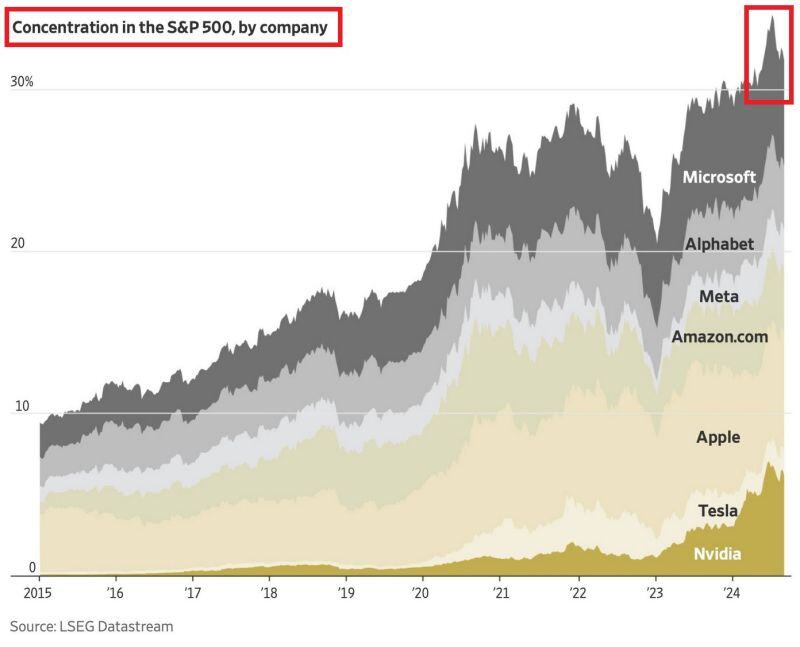
🚨IS THIS THE BIGGEST CONCENTRATION BUBBLE IN HISTORY?🚨
Magnificent 7 stocks now account for ~32% of the S&P 500, near the all-time high. This share has increased by 10 percentage points in just 1.5 years. This is even 10 percentage pts HIGHER than in the 2000 DOT-COM BUBBLE. Source: LSEG Datastream, Global Markets Investor
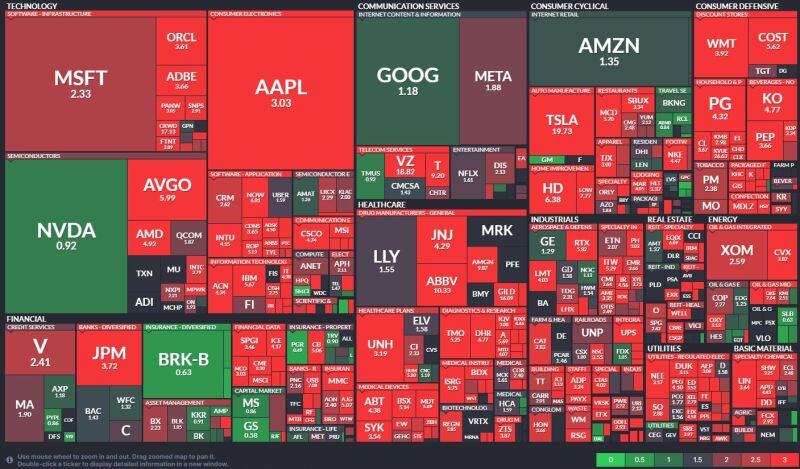
Glowtime Day: $AAPL PEG ratio high at 3.03x
Below a SP500 heatmap with PEG ratios... Source: Mike Zaccardi, CFA, CMT, MBA, Bloomberg
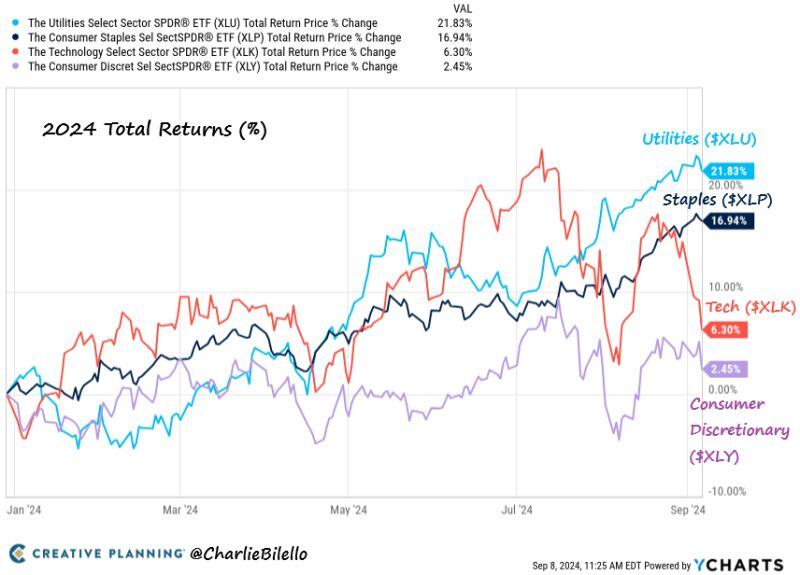
2024 S&P Sector Returns...
Utilities $XLU: +22% Consumer Staples $XLP: +17% Tech $XLK: +6% Consumer Discretionary $XLY: +2% Leadership has turned. This is a big shift from 2023.
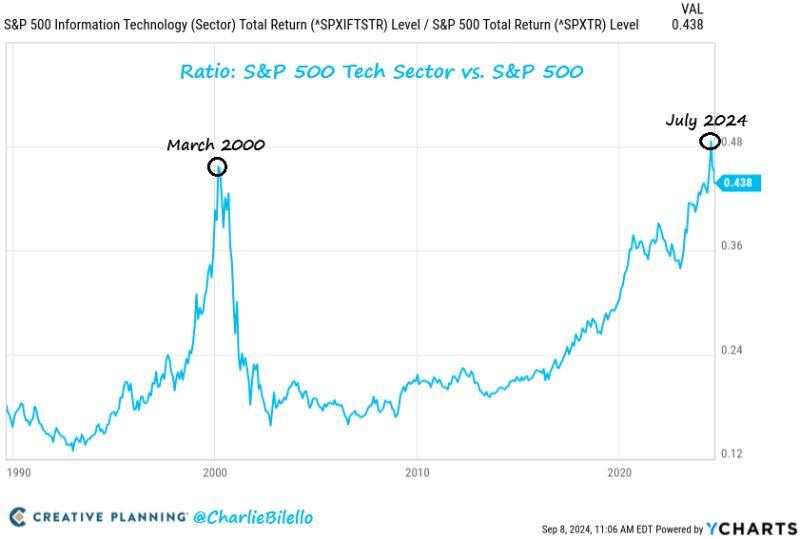
After surpassing the March 2000 relative strength high, the Tech sector has sharply underperformed over the last 2 months.
Is this the start of a secular change in leadership? Source: Charlie Bilello
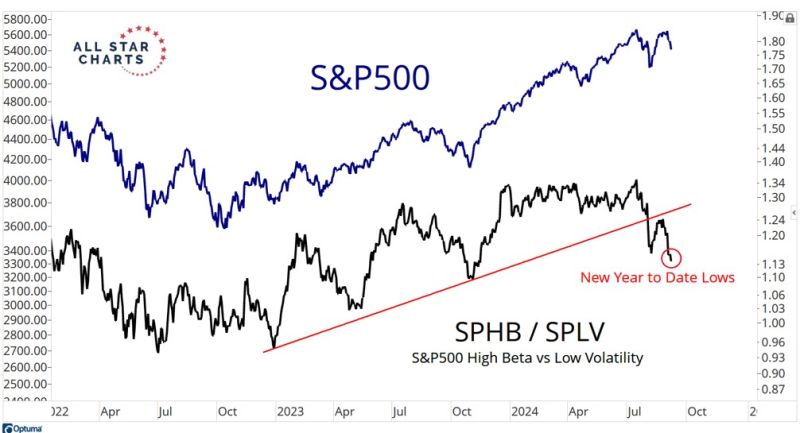
An important chart by J-C Parets >>> High Beta outperforming Low Volatility stocks is usually something we see in healthy market environments.
This year, however, High Beta has been struggling to make any progress vs their Low Volatility counterparts. "Beta" is essentially how volatile a stock is relative to its benchmark. So High Beta think $SMCI, $NVDA, $AMD, etc.. You have half the S&P500 High Beta Index in Technology and another 17% in Consumer Discretionary. In contrast, for Low Volatility think Berkshire Hathaway, Coca-Cola, Visa, Procter & Gamble. You'll find a lot of Financials, Consumer Staples, Utilities and Industrials in this group. Source: J-C Parets
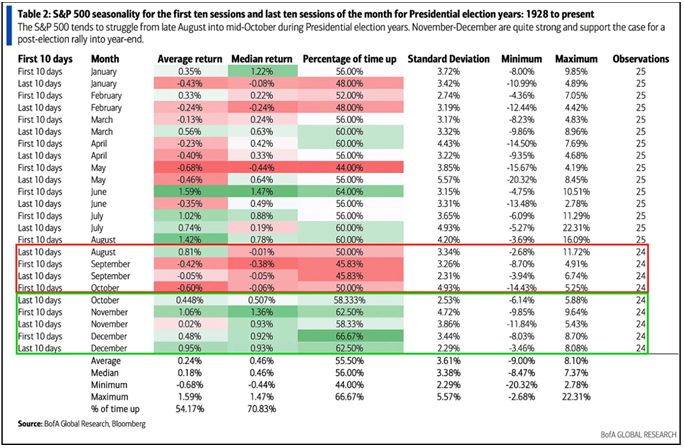
Markets tend to struggle from now until mid-October during Presidential election years
BofA