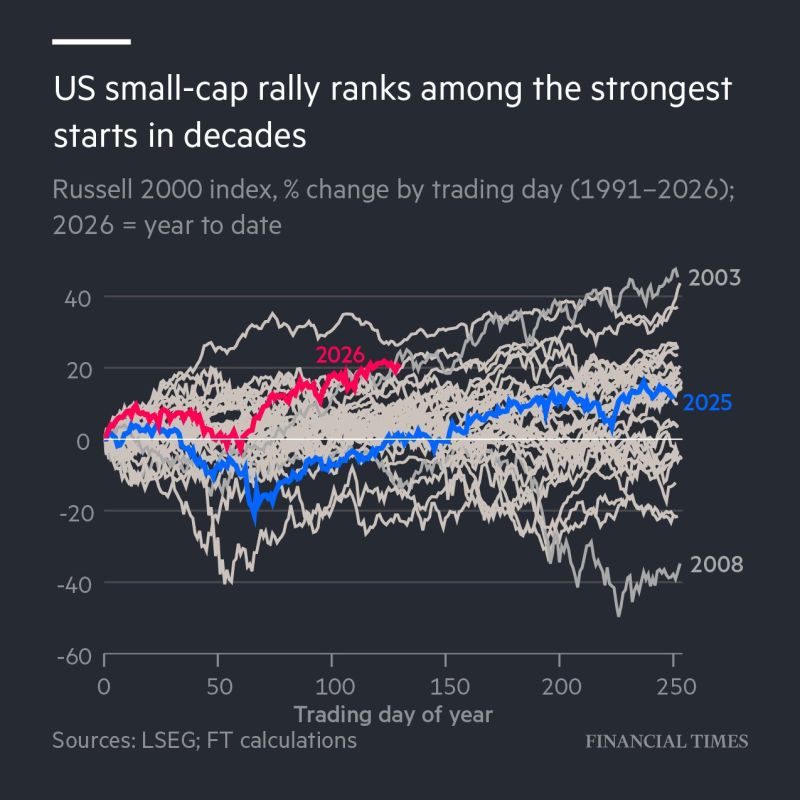
US small-cap stocks are bucking years of underperformance to enjoy their best year since 2003, helped by AI spending, tax changes and low valuations.
Source: FT
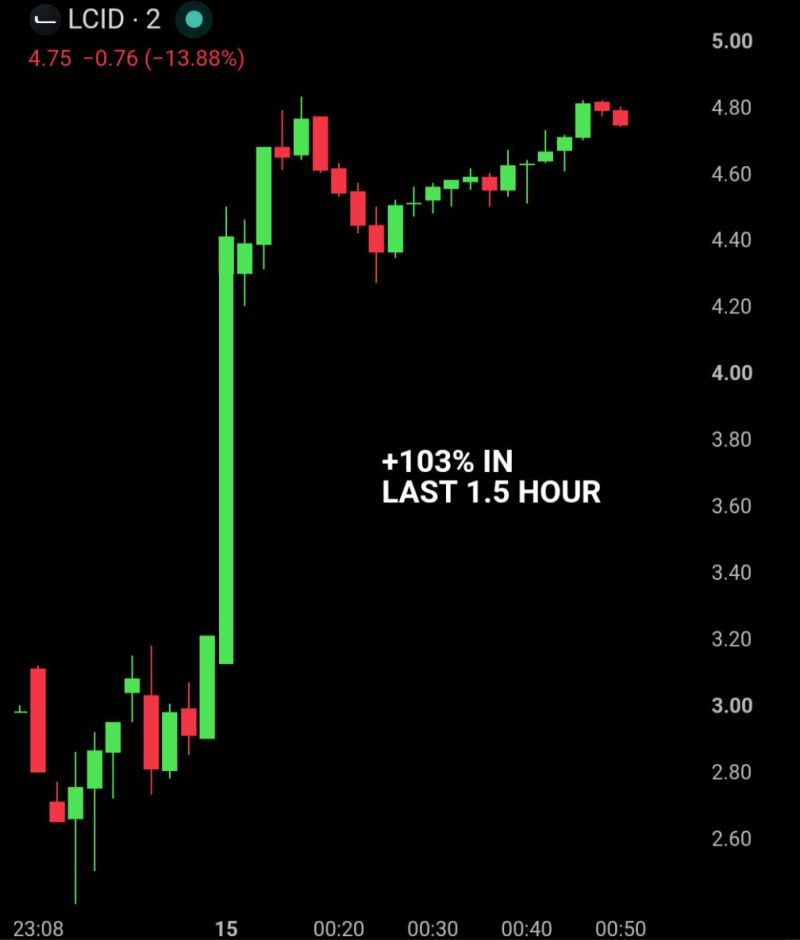
Lucid $LCID is up 103% in the last 1.5 hours after the company denied bankruptcy rumors.
Source: Bull Theory
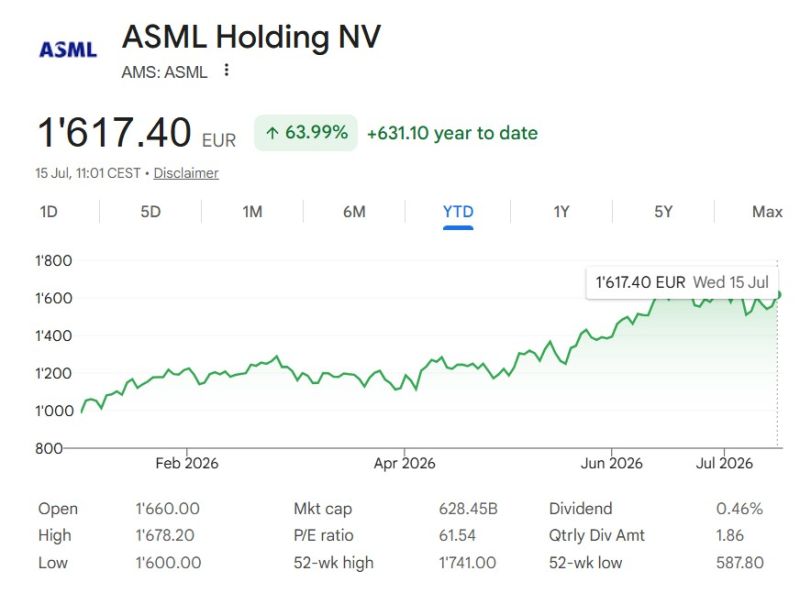
🔴 $ASML fantastic Q2 2026 earnings ‼️
ASML on Wednesday raised its guidance for the second time this year and reported stronger-than-expected quarterly results as its customers continue to ramp up production of AI chips. The Dutch semiconductor-equipment maker said it now expects full-year sales to come in between 43 billion euros ($49 billion) and 45 billion euros, and a gross margin of between 54 and 56%. It previously predicted annual net sales of between 36 billion and 40 billion euros, and a gross margin between 51% and 53%. The opened up 7% and is now up 64% YTD. Market cap is close to EUR 630 billion. ASML Q2 results In a nutshell: • EPS: €7.59 vs €6.88 est. • Revenue: €9.33B vs €8.87B est. • Gross Margin: 54.0% vs 51.9% est. 𝗢𝘂𝘁𝗹𝗼𝗼𝗸 𝗤𝟯 𝟮𝟬𝟮𝟲 Revenue: €11B-$12B vs €10.34B est. 𝗢𝘂𝘁𝗹𝗼𝗼𝗸 𝟮𝟬𝟮𝟲 Revenue: €43B-$45B vs €39.34B est. Source: Investing visuals @InvestingVisual CNBC
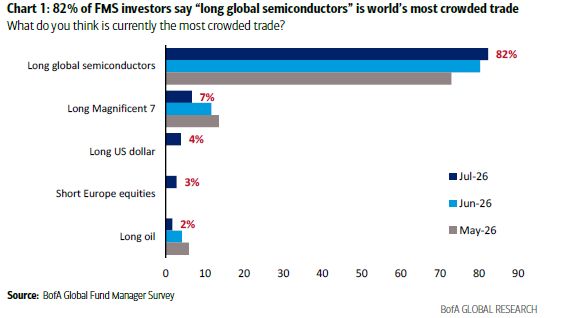
From this chart, it seems very clear what the most crowded trade is...
Source: BofA
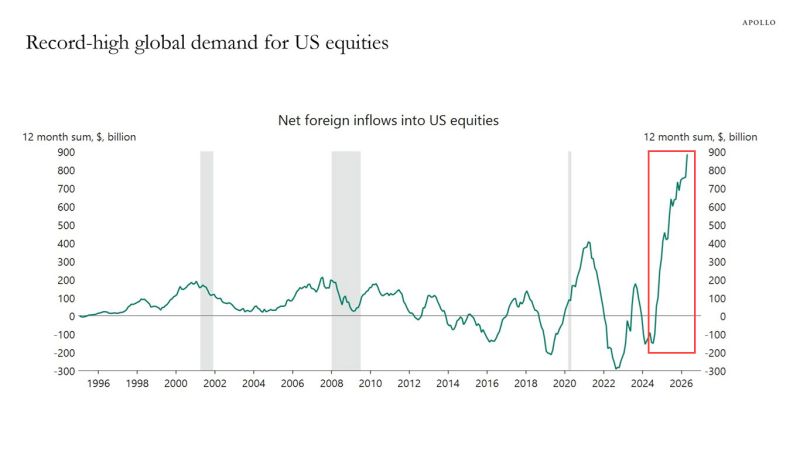
Net foreign inflows into U.S. equities hits record high
Source: Hedgeye, Apollo
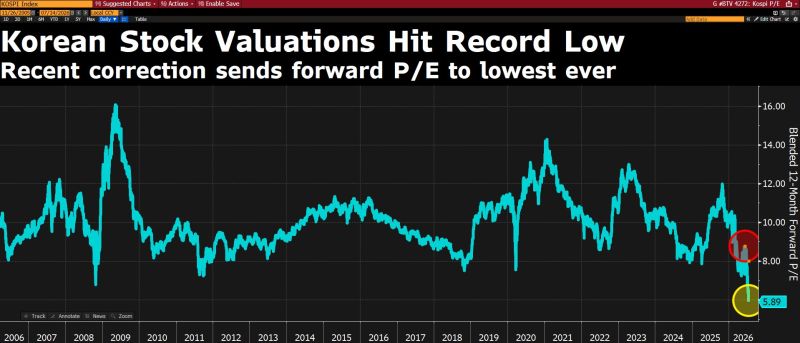
Cheapest bubble to burst ever?
If Korea's equity market was in a bubble this year and if that bubble had in fact just burst, would be the cheapest bubble to burst ever.. went from 8x earnings to 5x earnings now. Source: David Ingles @DavidInglesTV
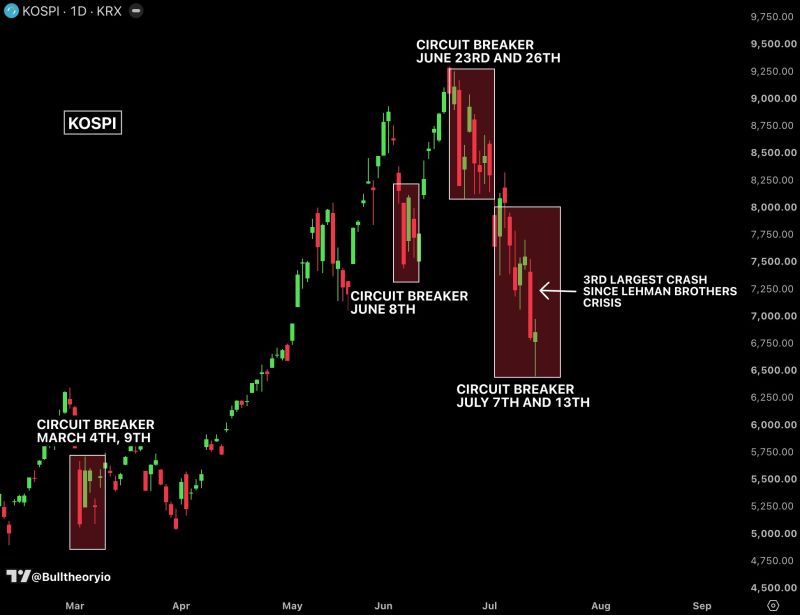
1.2 million Korean investors were hit with margin calls in a single market crash.
That's roughly 1 in every 30 working-age adults in the country. As the KOSPI plunged 8.95%—its third-worst session since Lehman—more than 1.2 million leveraged retail accounts triggered margin calls. Around 320,000–360,000 accounts were fully liquidated, with some investors left owing money even after their positions were sold. The damage was brutal: SK Hynix: -15.4% (largest daily drop on record) Samsung: -10.7% Meanwhile, retail brokerage cash balances have fallen by ₩30 trillion to their lowest level since February. And here's the key point: forced-selling data lags by two days. The full impact of Monday's liquidation wave has **not even appeared in the official figures yet. Source: Bull Theory
JP MORGAN $JPM
Q2’26 EARNINGS HIGHLIGHTS 🔹 Revenue: $58.02B (Est. $51.39B) 🟢; +27% YoY 🔹 EPS: $7.70 (Est. $5.72) 🟢; incl. $1.56/share from significant items 🔹 NII: $25.62B (Est. $25.64B) 🟡; +10% YoY 🔹 Net Charge-Offs: $2.37B (Est. $2.62B) 🟢 🔹 Investment Banking: $3.9B (Est. $3.06B) 🟢; +45% YoY 🔹 Equities S&T: $6.03B (Est. $3.98B) 🟢; +86% YoY 🔹 FICC S&T: $6.05B (Est. $6.29B) 🔴; +6% YoY Other Metrics: 🔹 Loans: $1.54T (Est. $1.52T) 🟢 🔹 Total Deposits: $2.71T (Est. $2.69T) 🟢 🔹 AUM: $5.1T; +18% YoY Segment Performance: 🔹 Consumer & Community Banking Revenue: $20.27B; +8% YoY 🔹 Commercial & Investment Bank Revenue: $24.85B; +27% YoY 🔹 Asset & Wealth Management Revenue: $6.85B; +19% YoY Financials: 🔹 Net Income: $21.2B; +41% YoY 🔹 Provision for Credit Losses: $2.52B 🔹 ROE: 24% (Est. 18%) 🟢 🔹 ROTCE: 29% 🔹 Standardized CET1 Ratio: 14.1% Capital Return: 🔹 Dividend: $1.50/share 🔹 Buybacks: $6.2B of common stock net repurchases 🔹 Authorization: New $50B buyback program effective July 1, 2026 Source: Wall St Engine