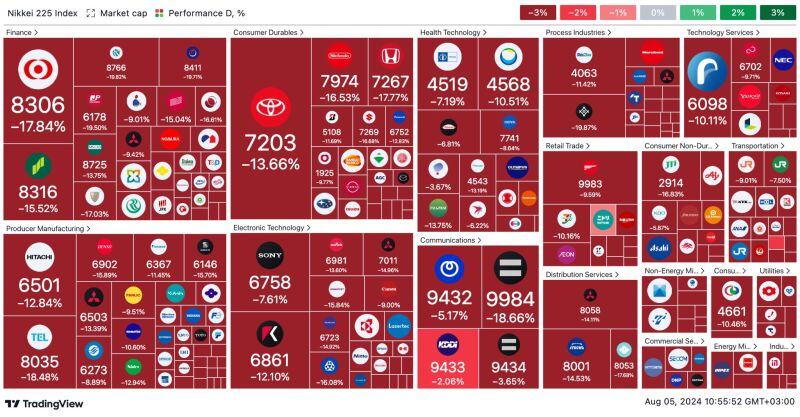
For the history books -> This was the worst day for Japan’s Nikkei stock index since the Black Monday crash of 1987, down 12.4%.
Source: Trading View
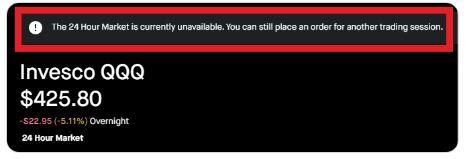
JUST IN 🚨: Robinhood suspends 24-hour trading market
Source: Barchart
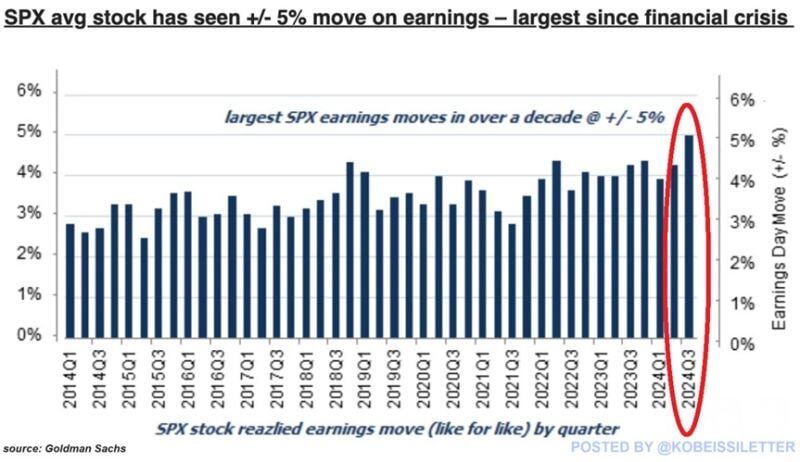
Volatility is back...
The average S&P 500 stock has seen a 5% one-day move after releasing Q2 2024 earnings. This marks the most volatile earnings season since the 2008 Financial Crisis, according to Goldman Sachs. By comparison, in Q1 2024 and Q4 2023, the average stock moved by ~4% one day after the release. The volatility index, $VIX, is now up ~95% over the last month alone. Volatility is opportunity for traders. Source: The Kobeissi Letter
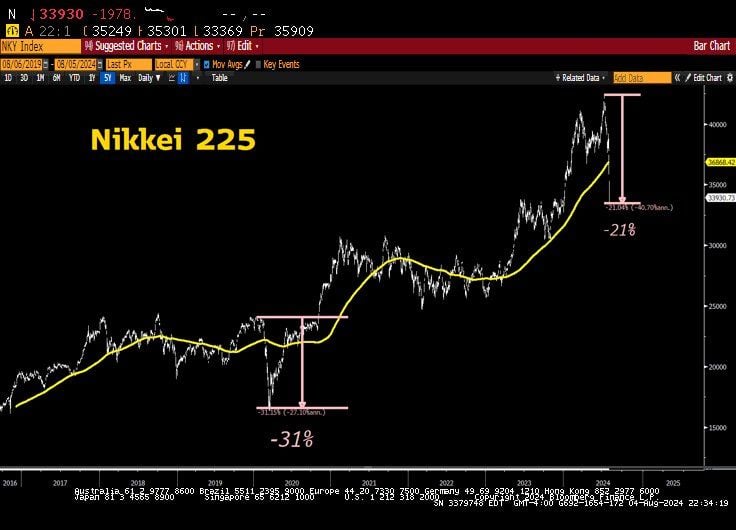
Japan Equities Crash, how significant?
Nikkei 225 lost 20% or more within a 3-week period? 1. 1990: -21%, (February 14 - March 7), asset price bubble plunge in Japan. 2. 2008: -23%, (September 26 - October 16) post the Lehman collapse. 3. 2013: -21%, (May 22 - June 13), economic stimulus panic. 4. 2020: -23%, (February 21 - March 13), the COVID pandemic panic of 2020. Source: Lawrence McDonald, Bloomberg
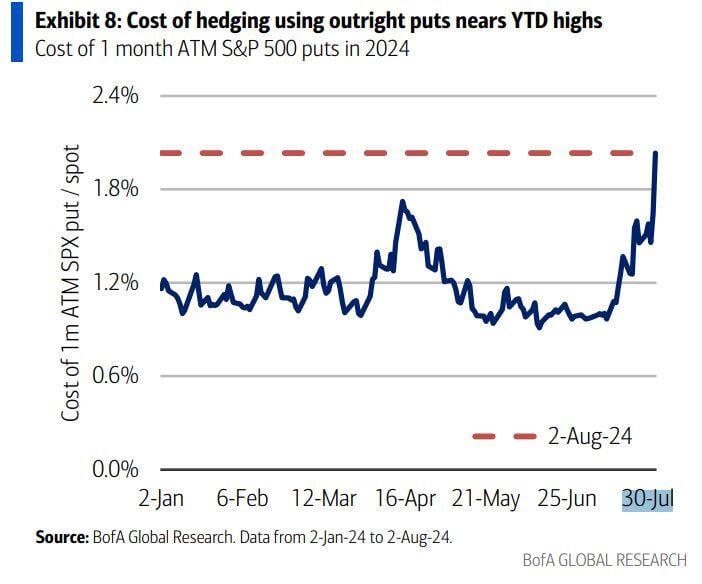
Cost of hedging using outright puts nears YTD highs
Source: BofA, Mike Z.
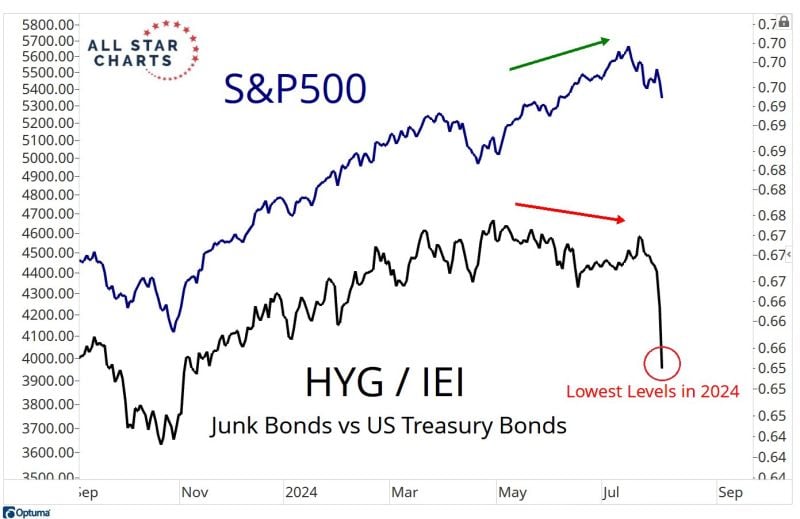
A worrying divergence...
Source: J-C Parets
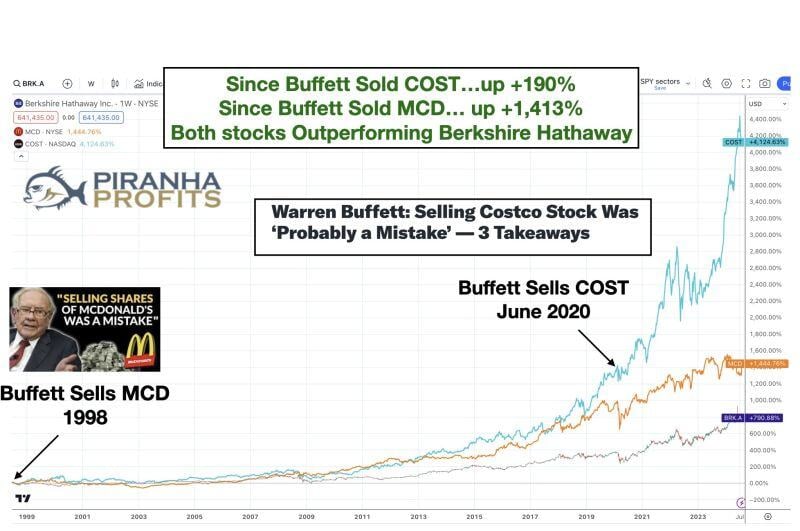
Should you sell your Apple because Buffet has been selling 50% of his Apple ($AAPL) shares?
Well, think twice. Buffett sold his entire Mcdonalds ($MCD) stock in 1998. Since then, MCD has increased +1,413%, outperforming Berkshire Hathaways returns. Buffett sold his entire Costco #($COST) stake in June 2020. Since then, COST has gained +190%, outperforming Berkshire as well. Buffett also sold all his stakes in airline stocks like Delta Airlines ($DAL) in March 2020. Since then, DAL is up +82% as well Lesson? Don't copy paste what other investors are doing, no matter how great they are. Source: Adam Khoo on X
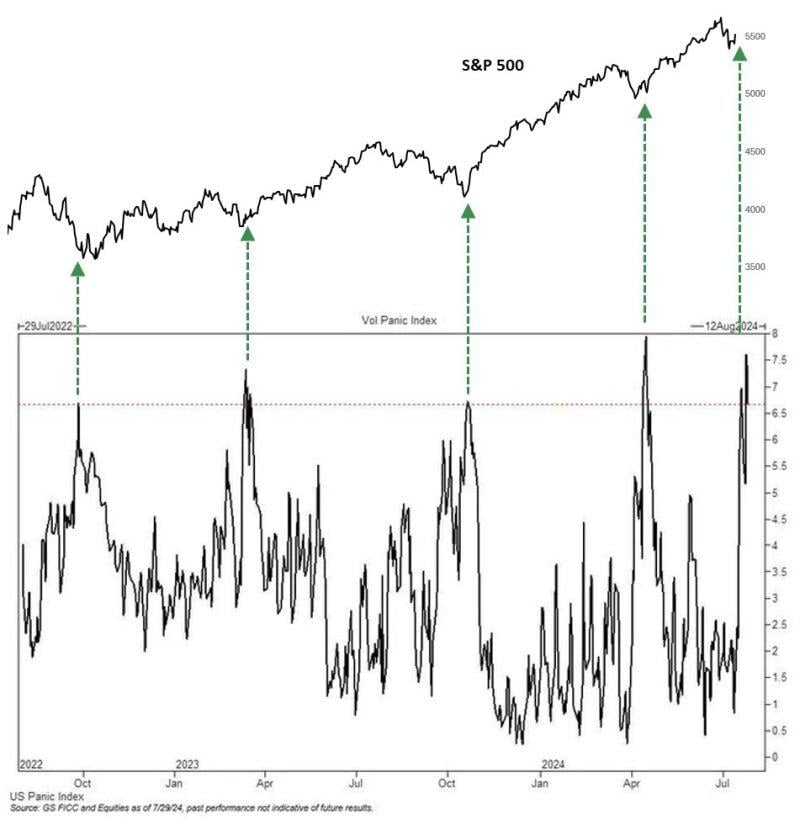
The Goldman US panic index is calculated as a rolling percentile of four equity volatility metrics
It spiked to one of the highest levels in two years in recent sessions... Source: Jason Goepfert on X