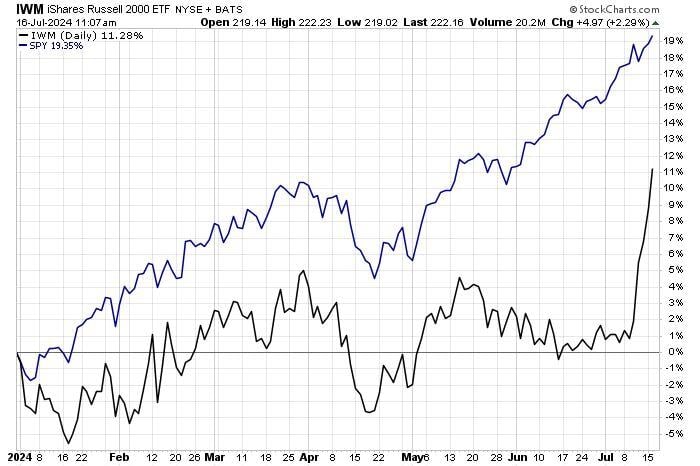
Russell 2000 $IWM is catching up with S&P500...
Russell 2000 is now up +11.3% YTD (with 10.3ppt has come in the last 5 sessions...) versus + for S£P 500 +19.35% YTD Source: Mike Zaccardi
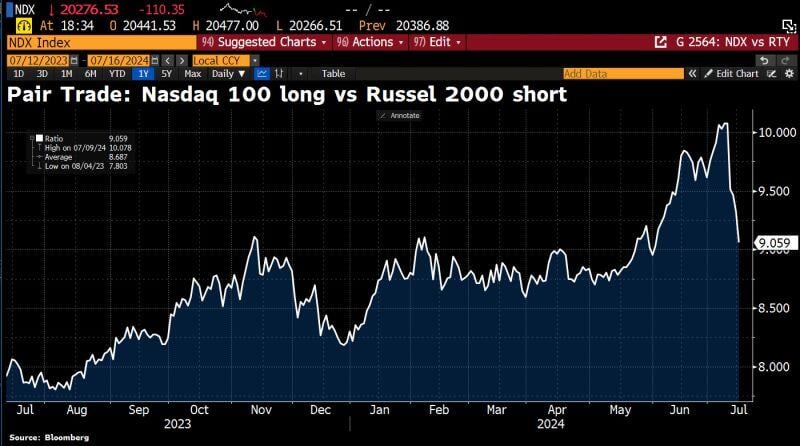
"Trump trade" (or the inflation rotation trade?) – Russell long vs Nasdaq 100 short – gains momentum.
Source: HolgerZ, Bloomberg
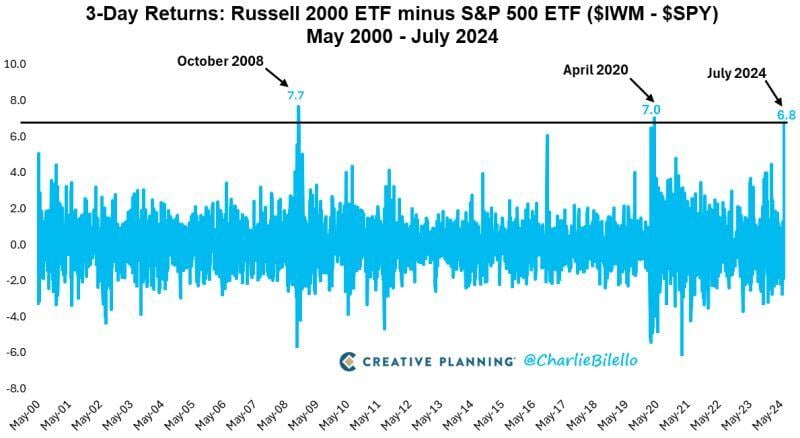
Us small caps are up 6.8% over the last 3 trading days while US Large Caps are flat.
The 6.8% spread is 6 standard deviations above the mean & the 3rd largest small outperformance since inception of the first small cap ETF in May 2000. $IWM $SPY Source: Charlie Bilello
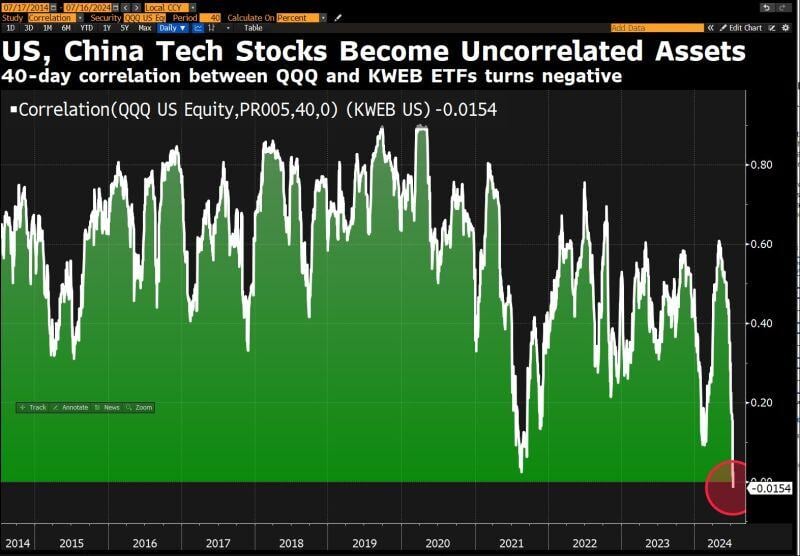
Us and China tech stocks have now become completely decoupled from each other, from a markets perspective.
David Ingles: "The 40-day correlation of $QQQ & $KWEB has turned negative. These are two behaviourally different assets FOR NOW. What might be good for one, may not necessarily boost the other. Chart underscores many global stories: difference in AI representation in each market, tech decoupling, geopolitical rifts, economies in different parts of their cycles". Source: David Ingles on X, Bloomberg
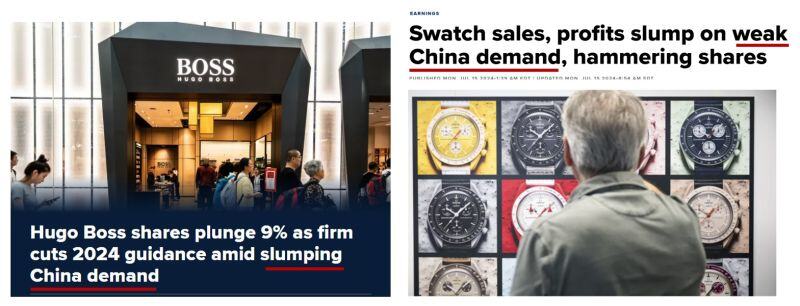
Weak China demand is weighing on European luxury & consumer discretionary stocks.
- Swatch Group (UHR SW) reported a steep fall in first half sales and earnings on Monday as the world’s biggest watchmaker struggled with weaker demand in China. The company’s drop in turnover was triggered by a slump in demand for luxury goods in China, including Hong Kong and Macau, with only the Swatch brand bucking the negative trend, increasing its sales in China by 10%, the company said in a statement. - Hugo Boss (BOSS GY) shares plunged as much as 10% Tuesday after the company cut its sales outlook. The German fashion house said Monday that it expects full-year sales of up to 4.35 billion euros ($4.73 billion) on macroeconomic challenges, particularly in China. The retailer becomes the latest high-end fashion line to warn of persistent woes in the luxury sector. Source: CNBC
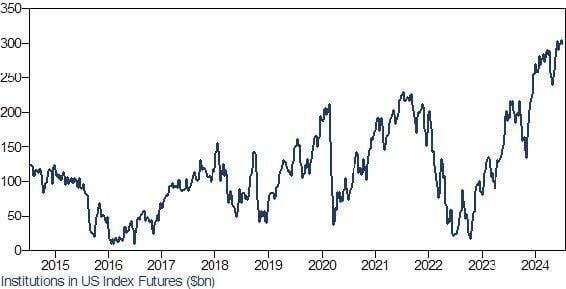
US equity futures traders have never, ever been 'longer' than they are now...
Source: GS
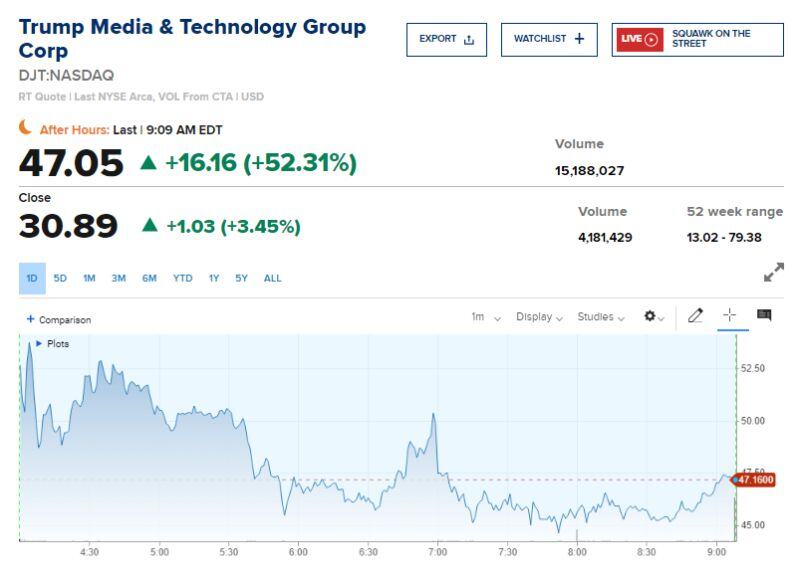
Trump Media shares $DJT surge 50% in premarket trading after assassination attempt
.
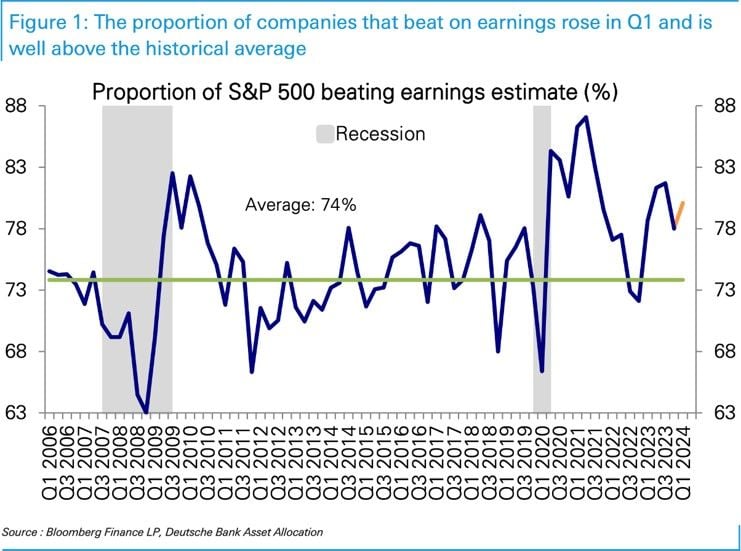
As we get into the heat of EPS season...
DB notes that more companies have been beating and by a larger amount in recent quarters. If this continues, it is tough to bet against this market... Source: Deutsche Bank, RBC