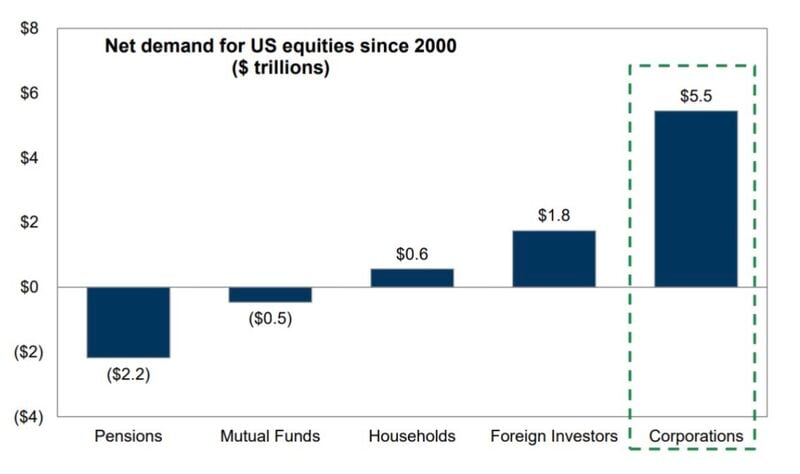
We are currently in the corporate buyback blackout period for most of the $SPX.
Since 2000, US corporations have bought back $5.5T of stock. This has amounted to more demand than any other market participant, and it’s not even close. 👇 Source: David Marlin, Goldman Sachs
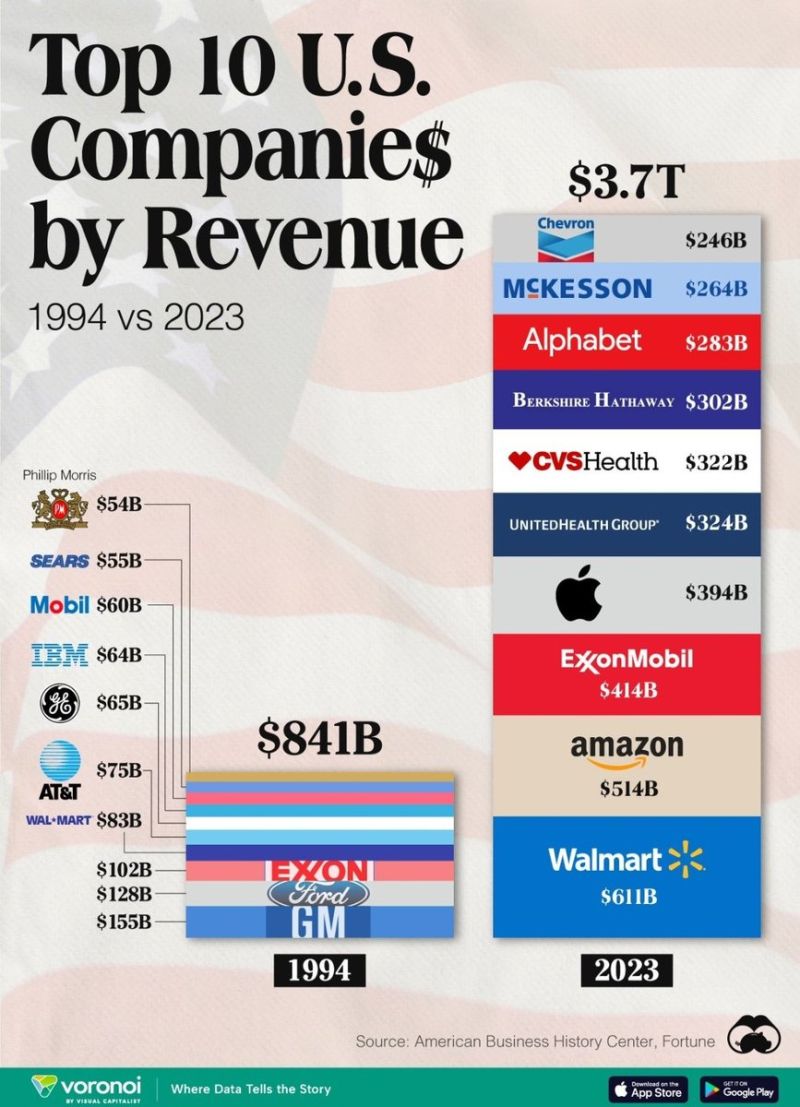
Top Companies by Revenue - Now vs. 3 Decades Ago
Source: Visual Capitalist thru Win Smart
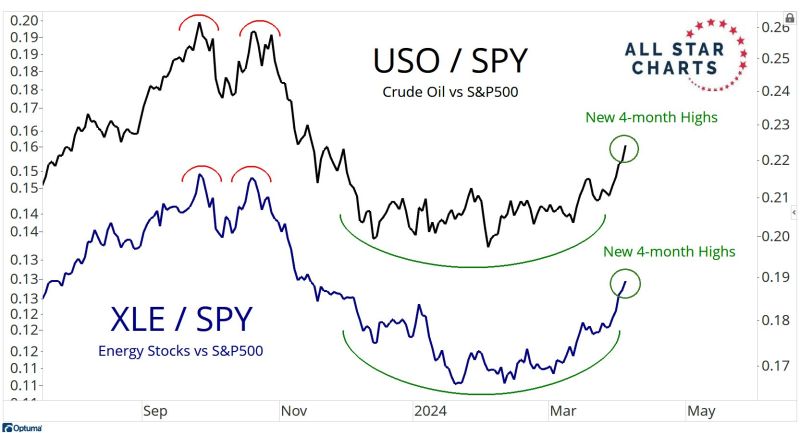
Below the relative chart of oil ETF $USO vs. S&P 500 ETF $SPY and the relative chart of oil stocks XLE vs. S&P 500 ETF $SPY.
Both just hit a 4.month relative high Source: J-C Parets
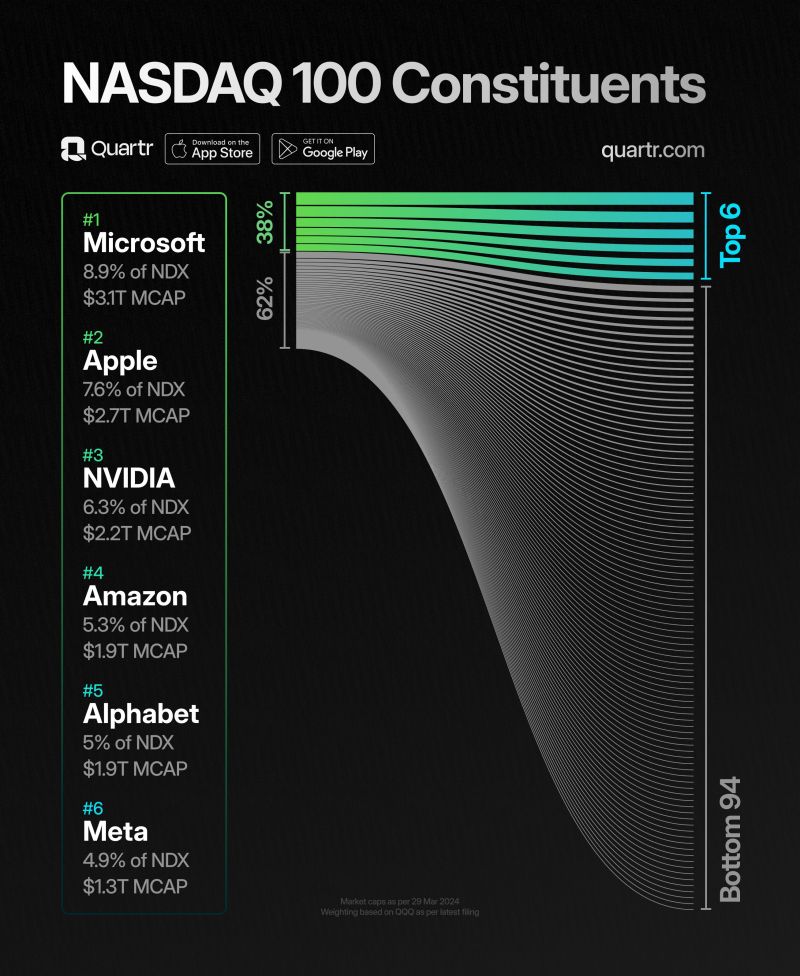
Amazing chart by Quartr.
It's quite astonishing: despite the NASDAQ 100's special mid-2023 rebalancing, the combined weight of $MSFT, $AAPL, $NVIDIA, $AMZN, $GOOGL, and $META still constitutes a substantial 38% of the index. Without this rare adjustment, the second of its kind in the last 25 years, these companies would currently represent 58% of the index.
A funny one by Trend Spider
True story $SPY

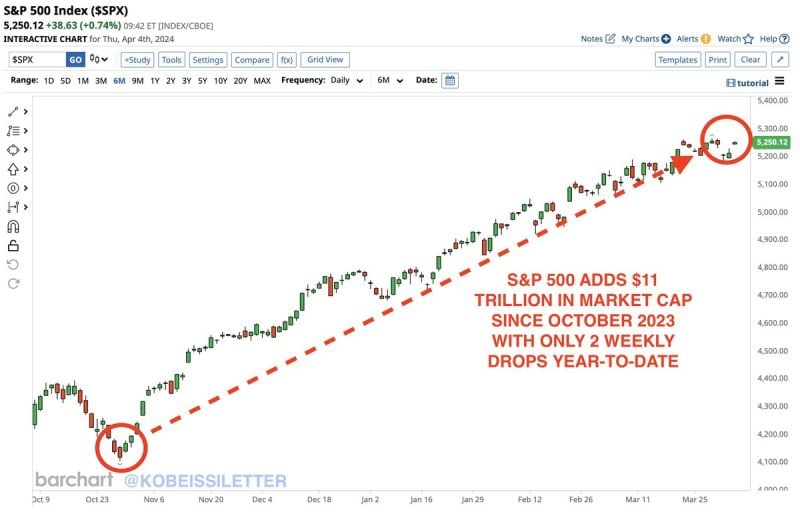
The S&P 500 has not had a weekly drop of 2% or more since the week of October 23rd, 2023.
There have only been a total of TWO weekly drops in the entire 2024 so far. Since October 2023, the S&P 500 has added almost $11 TRILLION in market cap. That's more than 4 TIMES the value of the Canadian stock market added in 5 months. $11 trillion in market cap is also the same value of China's entire stock market. Source: The Kobeissi Letter
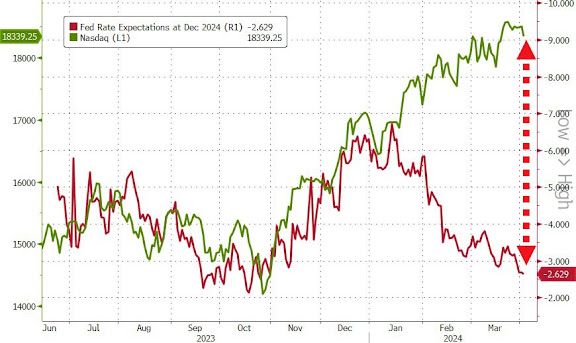
Maybe we have hit the pain threshold...
i,e the hashtag#nasdaq green line) can not move higher as the number of rate cuts expected for this year (red line) keeps decreasing... Source: www.zerohedge.com, Bloomberg
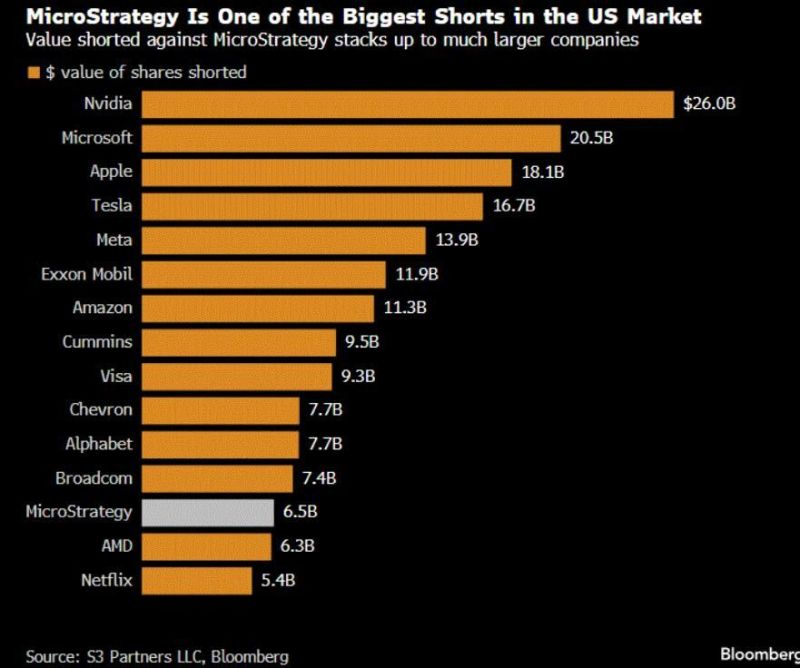
What are the biggest shorts?
Microstrategy $MSTR is one of the biggest shorts in the entire US market. Nvidia $NVDA is currently leading the pack. Source: Bloomberg