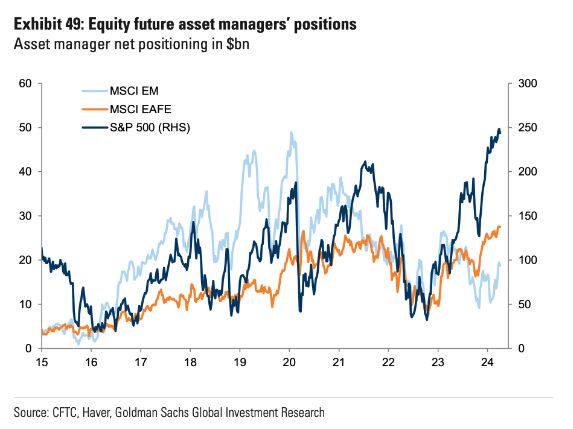
Equity market positioning is VERY extended (which is bad from a contrarian perspective).
As shown in the chart below, Asset Managers have built the largest equity futures position in history 🚨🚨🚨 Source: Barchart, Goldman Sachs, CFTC
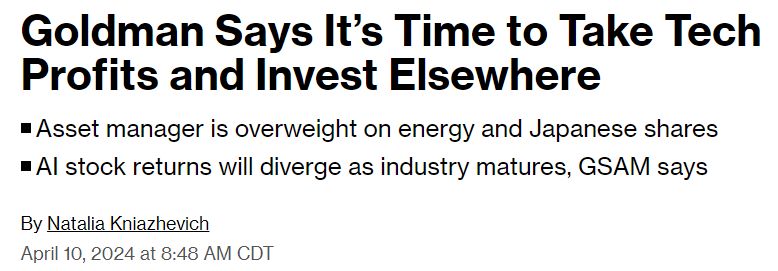
Goldman is embracing the rotational trade as well:
"Sell your Tech Stocks and invest elsewhere" says Goldman Sachs
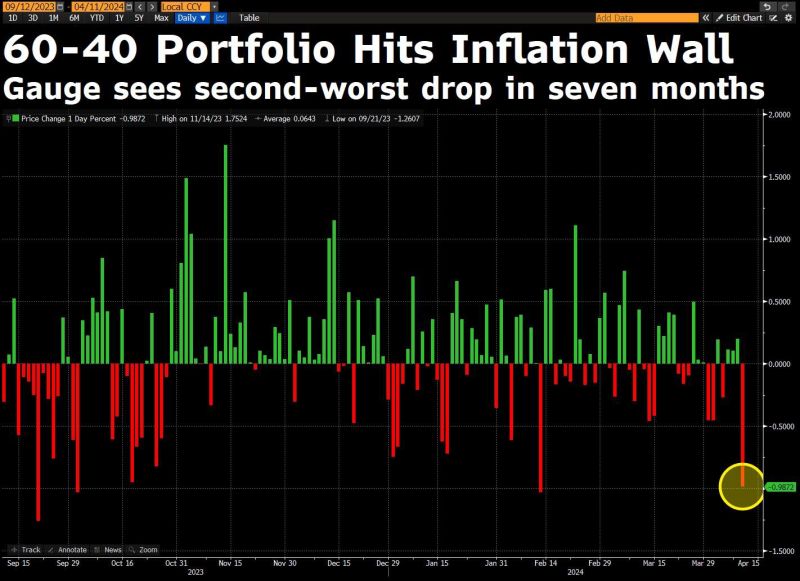
Yesterday was very painful for diversified 60-40 (equities / bonds) portfolios
Source: Bloomberg
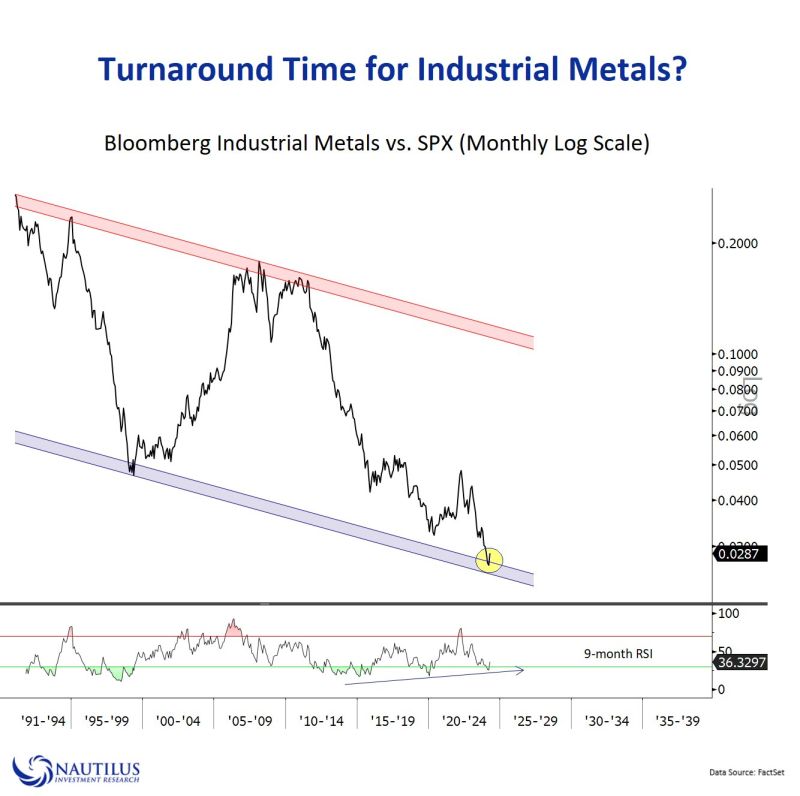
Industrial Metals relative strength (vs. $SPX) ready to turn?
Source: Nautilus Research
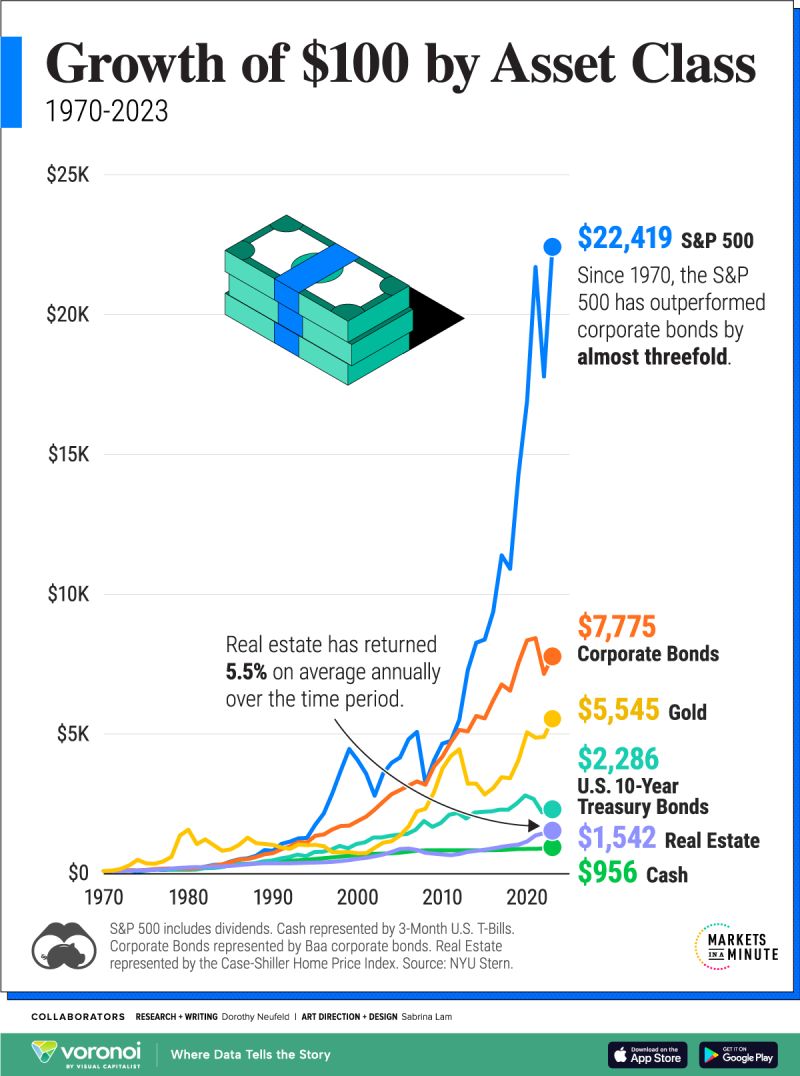
Visualizing the growth of $100, by asset class returns across U.S. equities, bonds, real estate, gold and cash since 1970.
source : visual capitalist
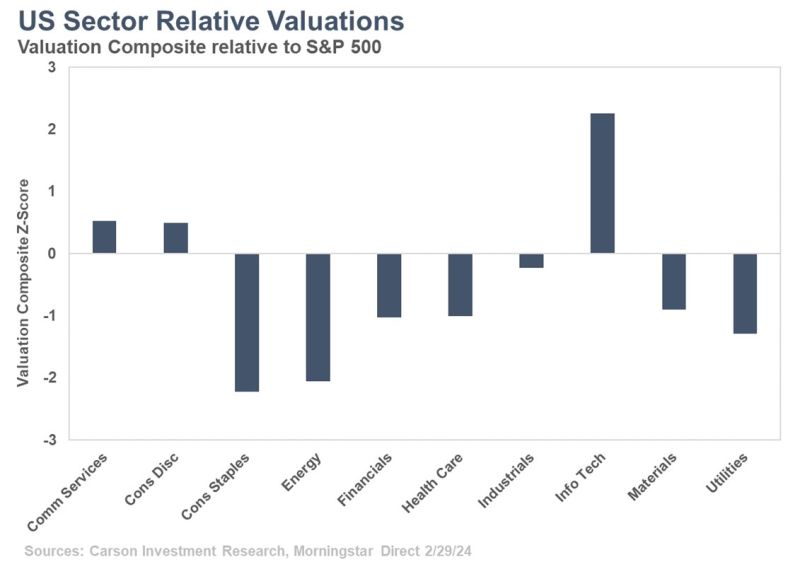
US stocks are expensive. That is true, but it is mainly due to tech.
If you look around you'll notice that areas like the cyclicals (energy, financials, materials, and industrials) are all fairly valued and in some cases outright cheap. Source: Carson Investment Research
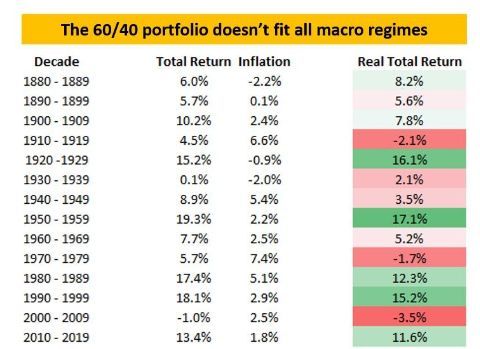
The 60/40 portfolio doesn't fit all macro regimes by Alfonso Peccatiello / The macro compass
The 60/40 portfolio (60% equities / 40% bonds) did work great for 3 of the last 4 decades, and that's because the macro regime was one of predictably low growth and inflation, and Central Banks ready to support markets and economies. But are you sure the next 10 years be the same as the last 10 years?
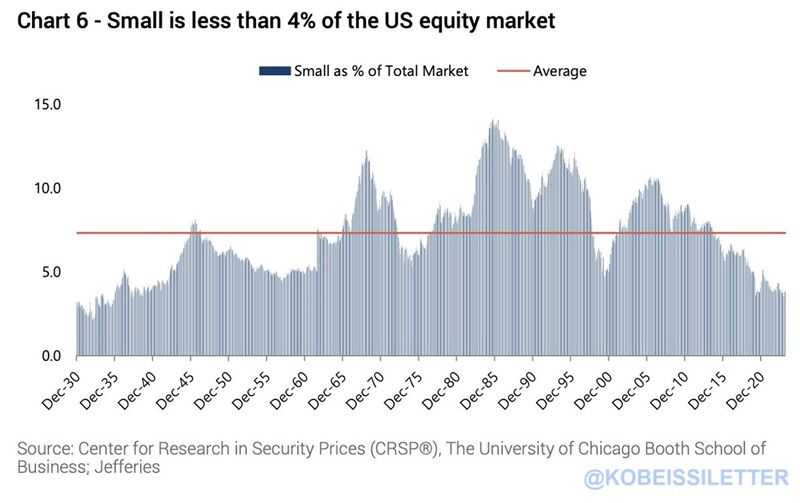
US smallcap stocks now account for less than 4% of the entire US equity market.
They now reflect the same percentage of the market as 1930 before the Great Depression. As AI-hype as spreads, small cap stocks have significantly underperformed large caps. Currently, more than one-third of the Russell 2000 index has negative earnings, down from ~45% in 2020. Small-cap stocks are now hated more than ever. Source: The Kobeissi Letter