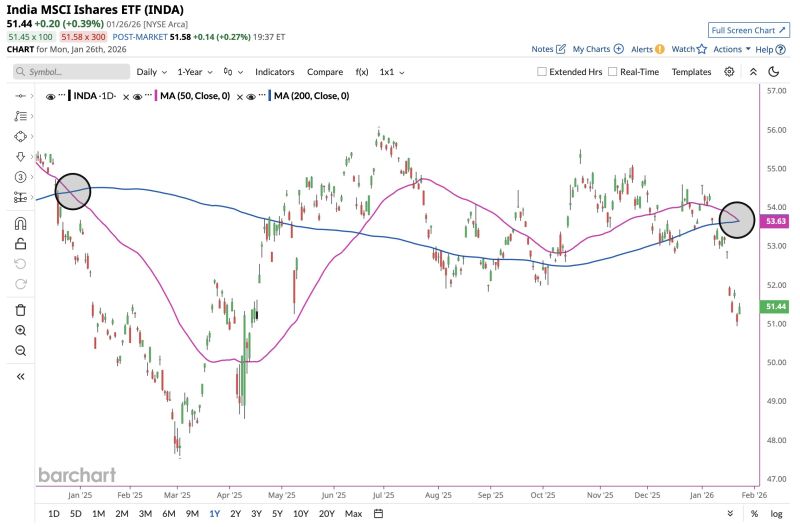
Indian Stocks $INDA form a Death Cross ☠️ for the first time this year
The last one sent prices plunging more than 10% over the next 10 weeks 📉📉 Source: Barchart
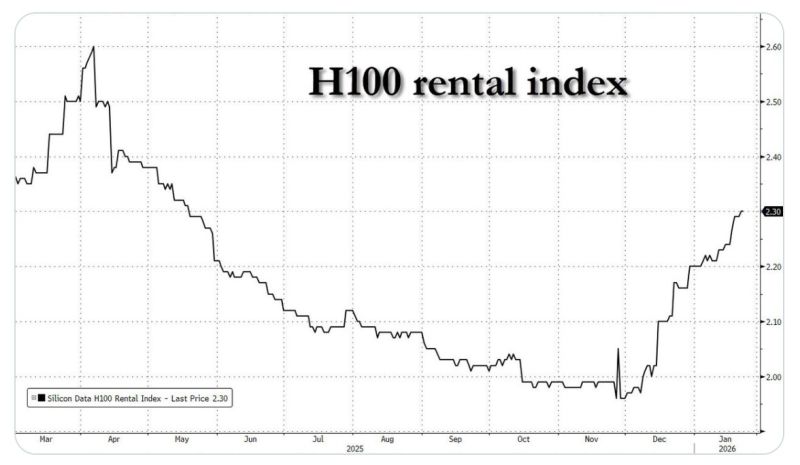
Why NVIDIA H100 Rental Prices Are Rising Again
The recent spike in NVIDIA H100 rental prices shows that the AI compute market remains volatile rather than oversupplied. Despite increased GPU availability, demand is being driven by year-end budget spending, creating temporary but intense surges in usage. The market is increasingly split between low-cost “neoclouds,” which offer cheaper but less reliable capacity, and hyperscalers, which charge premium prices for stability and integration. The main constraint is no longer GPU supply but power and grid capacity, with electricity and cooling costs now embedded in rental pricing. Meanwhile, delays in deploying NVIDIA’s next-gen Blackwell (B200) chips keep H100s in high demand as the current workhorse, preventing prices from falling in a normal hardware cycle. Source hashtag#chart: www.zerohedge.com
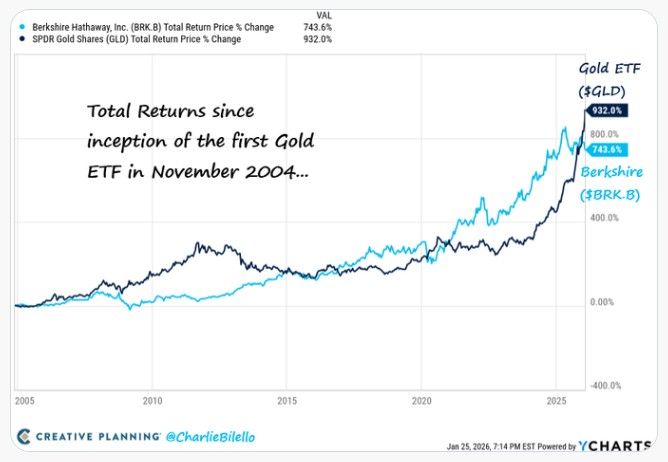
Total Returns since inception of the first Gold ETF in November 2004
Berkshire Hathaway $BRK.B: +744% Gold ETF $GLD: +932% Source: Charlie Bilello
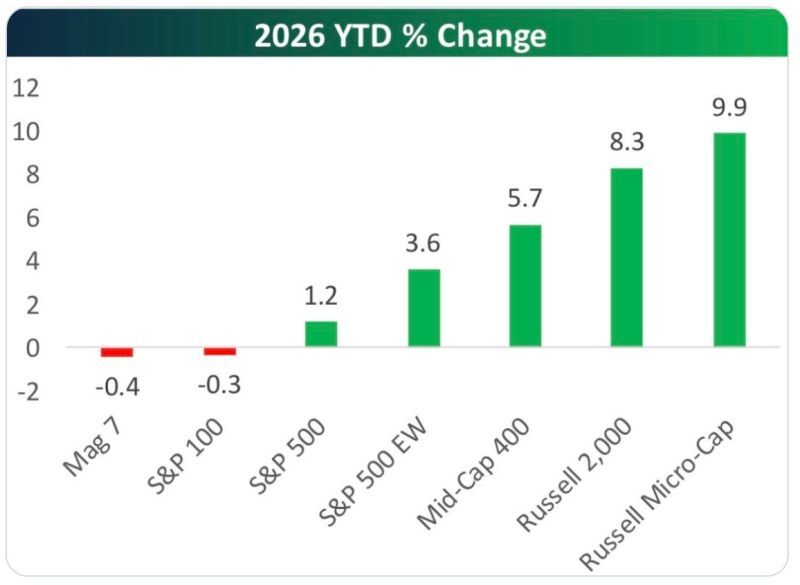
The smaller, the better so far in 2026
Source: Bespoke @bespokeinvest
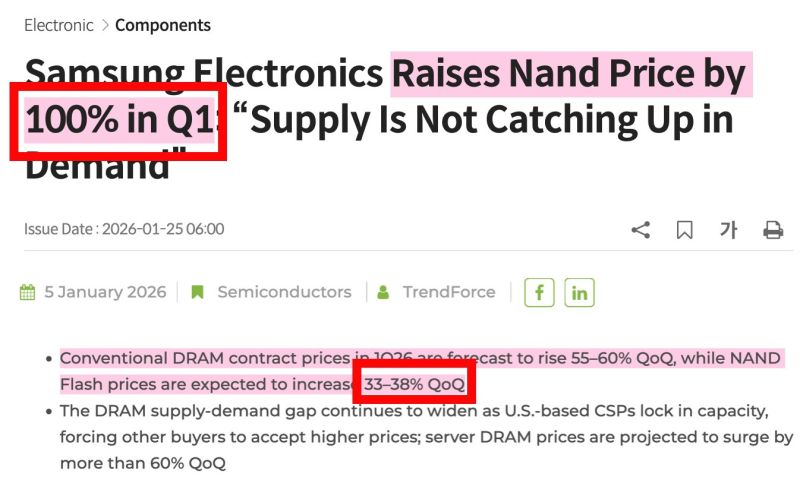
In case you missed it... This just happened: "Samsung increases NAND prices by 100%"
Estimates were 33-38% Q/Q growth - Trendforce This is an absolute shock. It's called the "Memory Supercycle" for a reason with $MU, Samsung, and SK Hynix + $SNDK. In simpler terms: That extra 65% increase (from 35% to 100%) is pure, added high-margin profit. If $MU guided for 68.0% gross margins Q2 2026, and we see a 100% NAND hike from 33-38% est, that could bring gross margin projections over 73-75%+. This is a blowout. Source: Serenity @aleabitoreddit
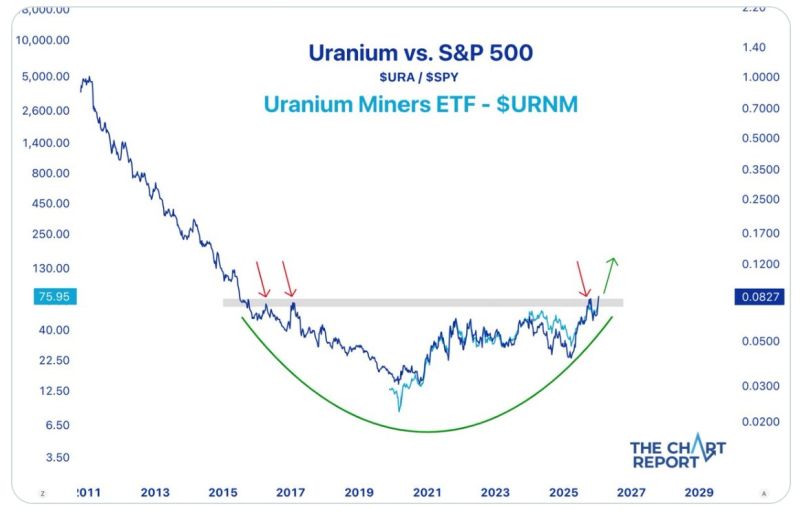
Uranium miners closed at new all-time highs last week. Is the relative trend just getting started
$URA $URNM $SPY Source: Donovan Jackson @TheDonInvesting on X The chart report
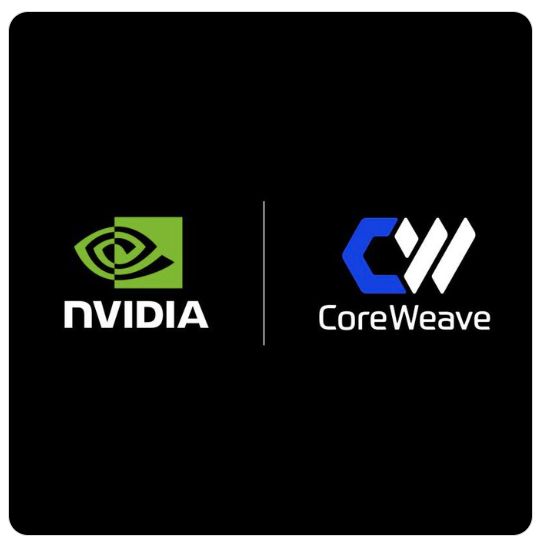
CoreWeave Behind the AI Hype, a Debt-Fueled Illusion
Nvidia is investing $2B in CoreWeave, deepening a partnership central to AI infrastructure expansion. CoreWeave plans to build over 5 GW of AI data centers by 2030 using Nvidia’s next-gen platforms. However, despite the hype, CoreWeave’s financials raise serious concerns: the company is losing money on every dollar of revenue, carries a massive working-capital deficit, holds over $10B in long-term debt, and relies on rapidly depreciating GPU assets. Facing weak demand, CoreWeave is increasingly using “compute-for-equity” deals—trading GPU capacity for startup equity at inflated valuations—effectively acting like an AI venture capitalist rather than a stable infrastructure provider. The business model depends on continued access to debt markets; if funding dries up, risks fall heavily on retail investors while early institutional players are likely already exiting.
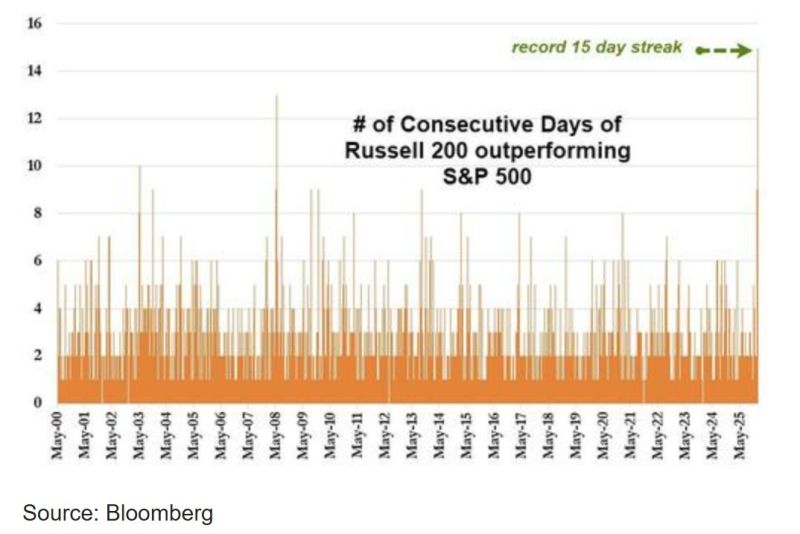
Yesterday was the 15th straight day that the S&P 500 ($SPY) has failed to outperform the Russell 2000 ($IWM)
IWM is now outperforming SPY by almost 900bps YTD... Source: www.zerohedge.com, Bloomberg