The new merger between xAi and SpaceX means the following are all under one company
The new merger between xAi and SpaceX means the following are all under one company: - SpaceX rockets, with 90% market share of launching mass into orbit. - Starlink, the only global telecommunications system. - Starshield, another version of Starlink for the US military which enables the US military to communicate around the planet without using the telecomm systems of any other country. - xAi, Grok - X (formerly Twitter) Source: Sawyer Merritt @SawyerMerritt WallStreetMav (@Wall Street Mav)

Waymo just confirmed it has raised $16 Billion at a $126 Billion valuation
Source: Evan on X

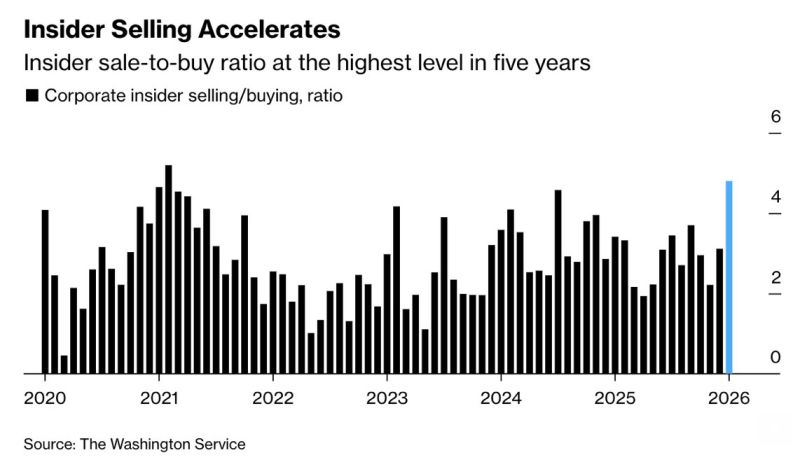
Corporate Insiders are dumping shares at the fastest pace in 5 years
Source: Bloomberg
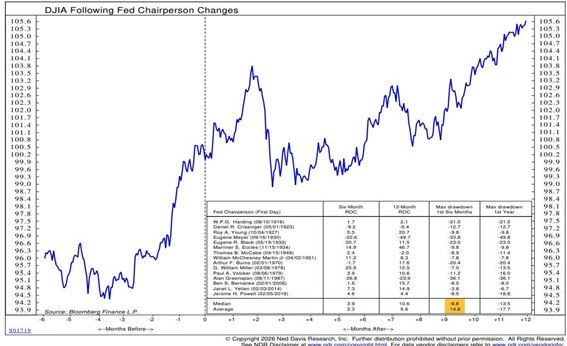
The average drawdown in the first 6 months of a new Fed Chair is 15%.
The market likes to test them... Source: NDR, RBC
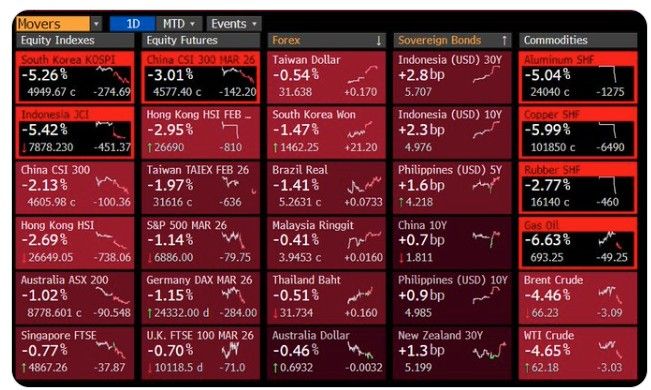
Markets in Asia are getting shredded on Monday.
Indonesia and Korea down over 5% each; commodities tossed out the window Source: David Ingles
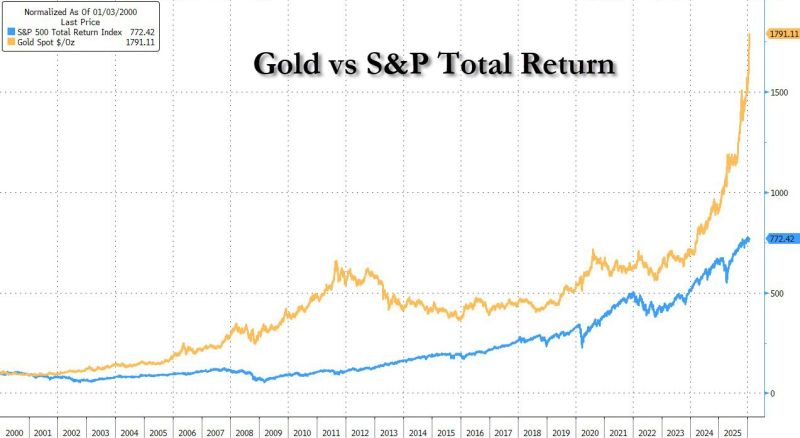
Gold vs S&P total return.
A rock has outperformed the collective genius of the US capital markets by more than 100% Source: zerohedge
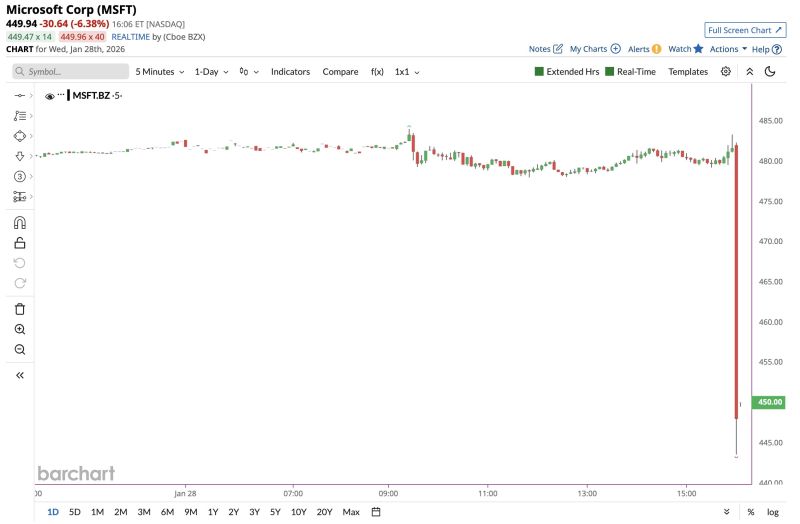
$MSFT with a strong double beat in Q4. The stock is down 6% despite the strong results due to heavy spending.
Microsoft delivered impressive headline numbers, with revenue jumping 17% to $81.3 billion and Azure cloud growth accelerating to 39%, driven by fierce AI demand. The Intelligent Cloud segment is now a massive engine, crossing $32.9 billion in sales. However, capital expenditure nearly doubled to ~$30 billion, raising fears about cash burn. Second, the massive 60% profit jump can be misleading as it includes a $7.6 billion paper gain from the OpenAI investment. Stripping that out, real profit growth was much lower, leaving investors worried that the costs of the AI boom are rising faster than the immediate cash returns. 🔹 EPS: $4.14 vs. $3.91 est. ✅ 🔹 Revenue: $81.27B vs. $80.31B est. ✅ Key takeaways: 🔸 Intelligent Cloud rev: +29% YoY 🔸 Productivity rev: +16% YoY 🔸 Computing rev: -3% YoY 🔸 MSFT Cloud rev: +26% YoY 🔸 Azure/Cloud: +39% YoY Source: KaizenInvestor @Kaizen_Investor Barchart
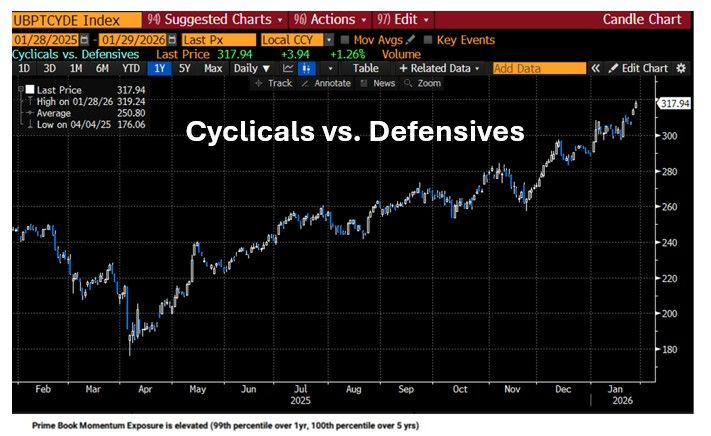
Cyclicals keep outperforming defensives...
The message from the market on the macro cycle sems pretty clear Source: Bloomberg