The Silver Miners ETF $SIL closed at a decade high on Friday, reaching a critical breakout level. 👇
Source: Oliver Groß @minenergybiz

Record close for VanEck Gold Miners ETF $GDX on weekly basis, taking out the 2011 high.
Source: NDR, Rob Anderson on X

The "buy the dip" mentality is intact.
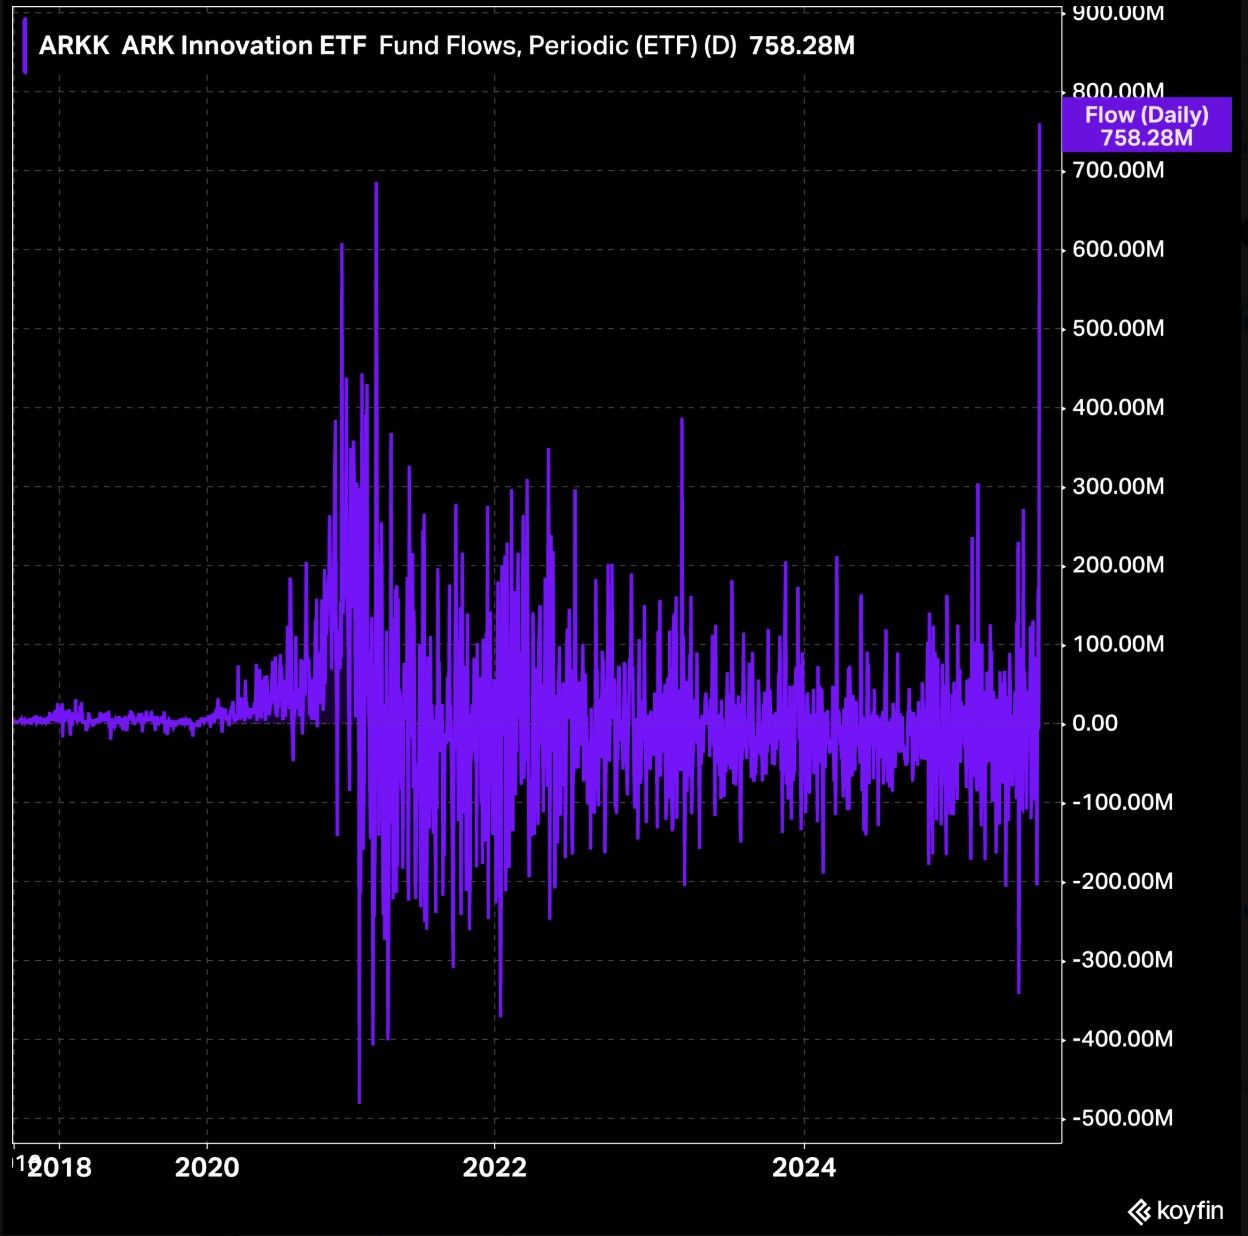
$ARKK Cathie Wood's ARK Innovation fund $ARKK saw its largest ever single day of inflows on Friday. Source: Koyfin
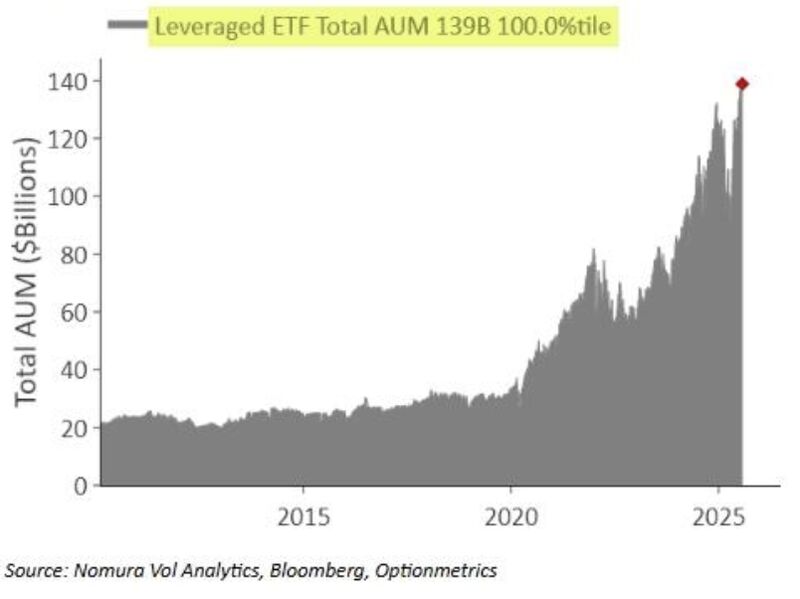
Investors have now plowed $139 Billion into Leveraged ETFs, the highest amount in history 🤯 Risk on folks, Risk on 🤑🫡🚀 🤢
Source: Barchart
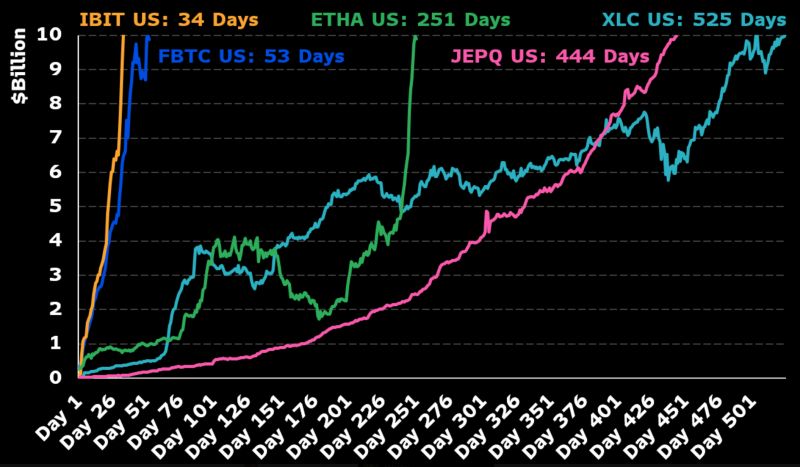
LOOK OUT: $ETHA iShares ethereum Trust ETF just hit $10b in one year flat, the 3rd fastest ETF to hit that mark in history after (you guessed it) two bitcoin ETFs $IBIT & $FBTC.
Amazingly it went from $5b to $10b in just 10 days. The ETF is Top 5 in flows for the last month and the week Source: Bloomberg, Eric Balchunas
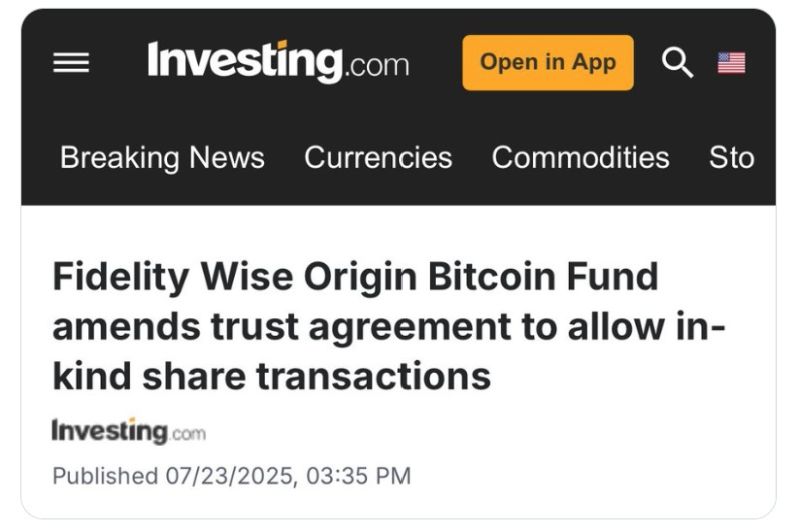
JUST IN:
Fidelity’s Bitcoin ETF has amended its trust agreement to allow in-kind creations and redemptions, meaning shares can be created or redeemed using bitcoin instead of cash, pending regulatory approval. Source: @BitcoinNewsCom
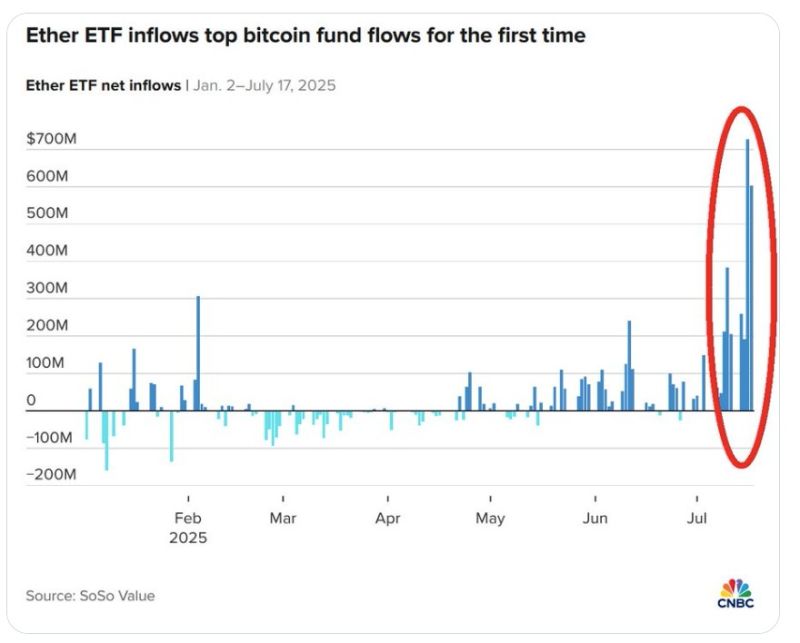
Ether ETFs saw $534 million in inflows on Tuesday, the 4th largest on record.
BlackRock alone bought $426 million. That’s now 13 straight days of inflows, totaling over $4 BILLION. Investors including Wall Street are going ALL IN on cryptos. Source: Global Markets Investor
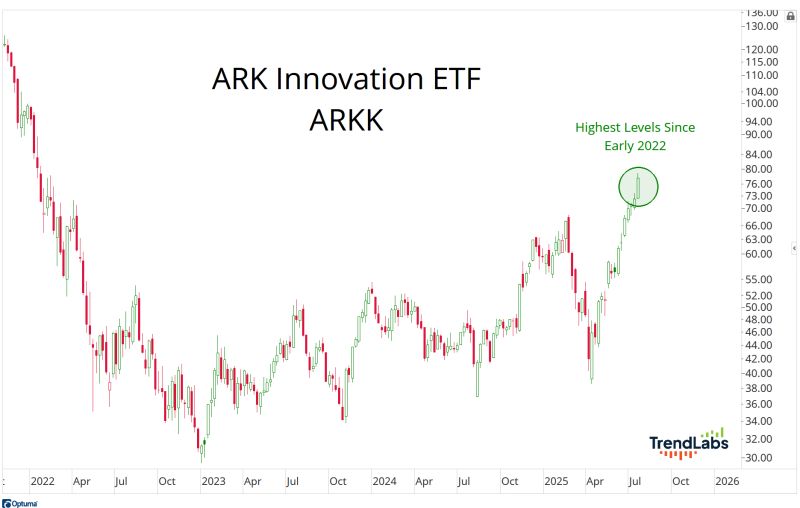
The ARK Innovation ETF is up 37% this year.
The SP500 is only up 7%. Meanwhile, over the past 12 months, the S&P500 is up 14%. ARKK is up 60%. The short interest in ARKK right now is the highest it's ever been. Source: J-C Parets, Trendlabs