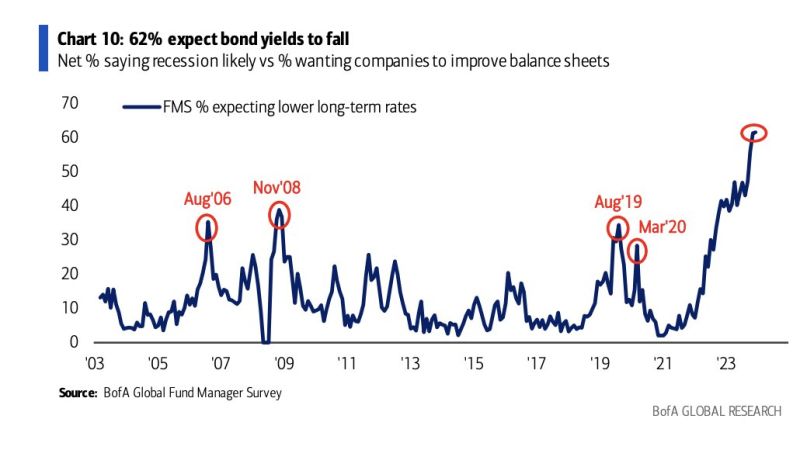
Bond trade looks a bit crowded: Record 62% of Fund Managers polled by BofA in December expect bond yields to be lower in 12 months’ time.
Source: BofA, HolgerZ
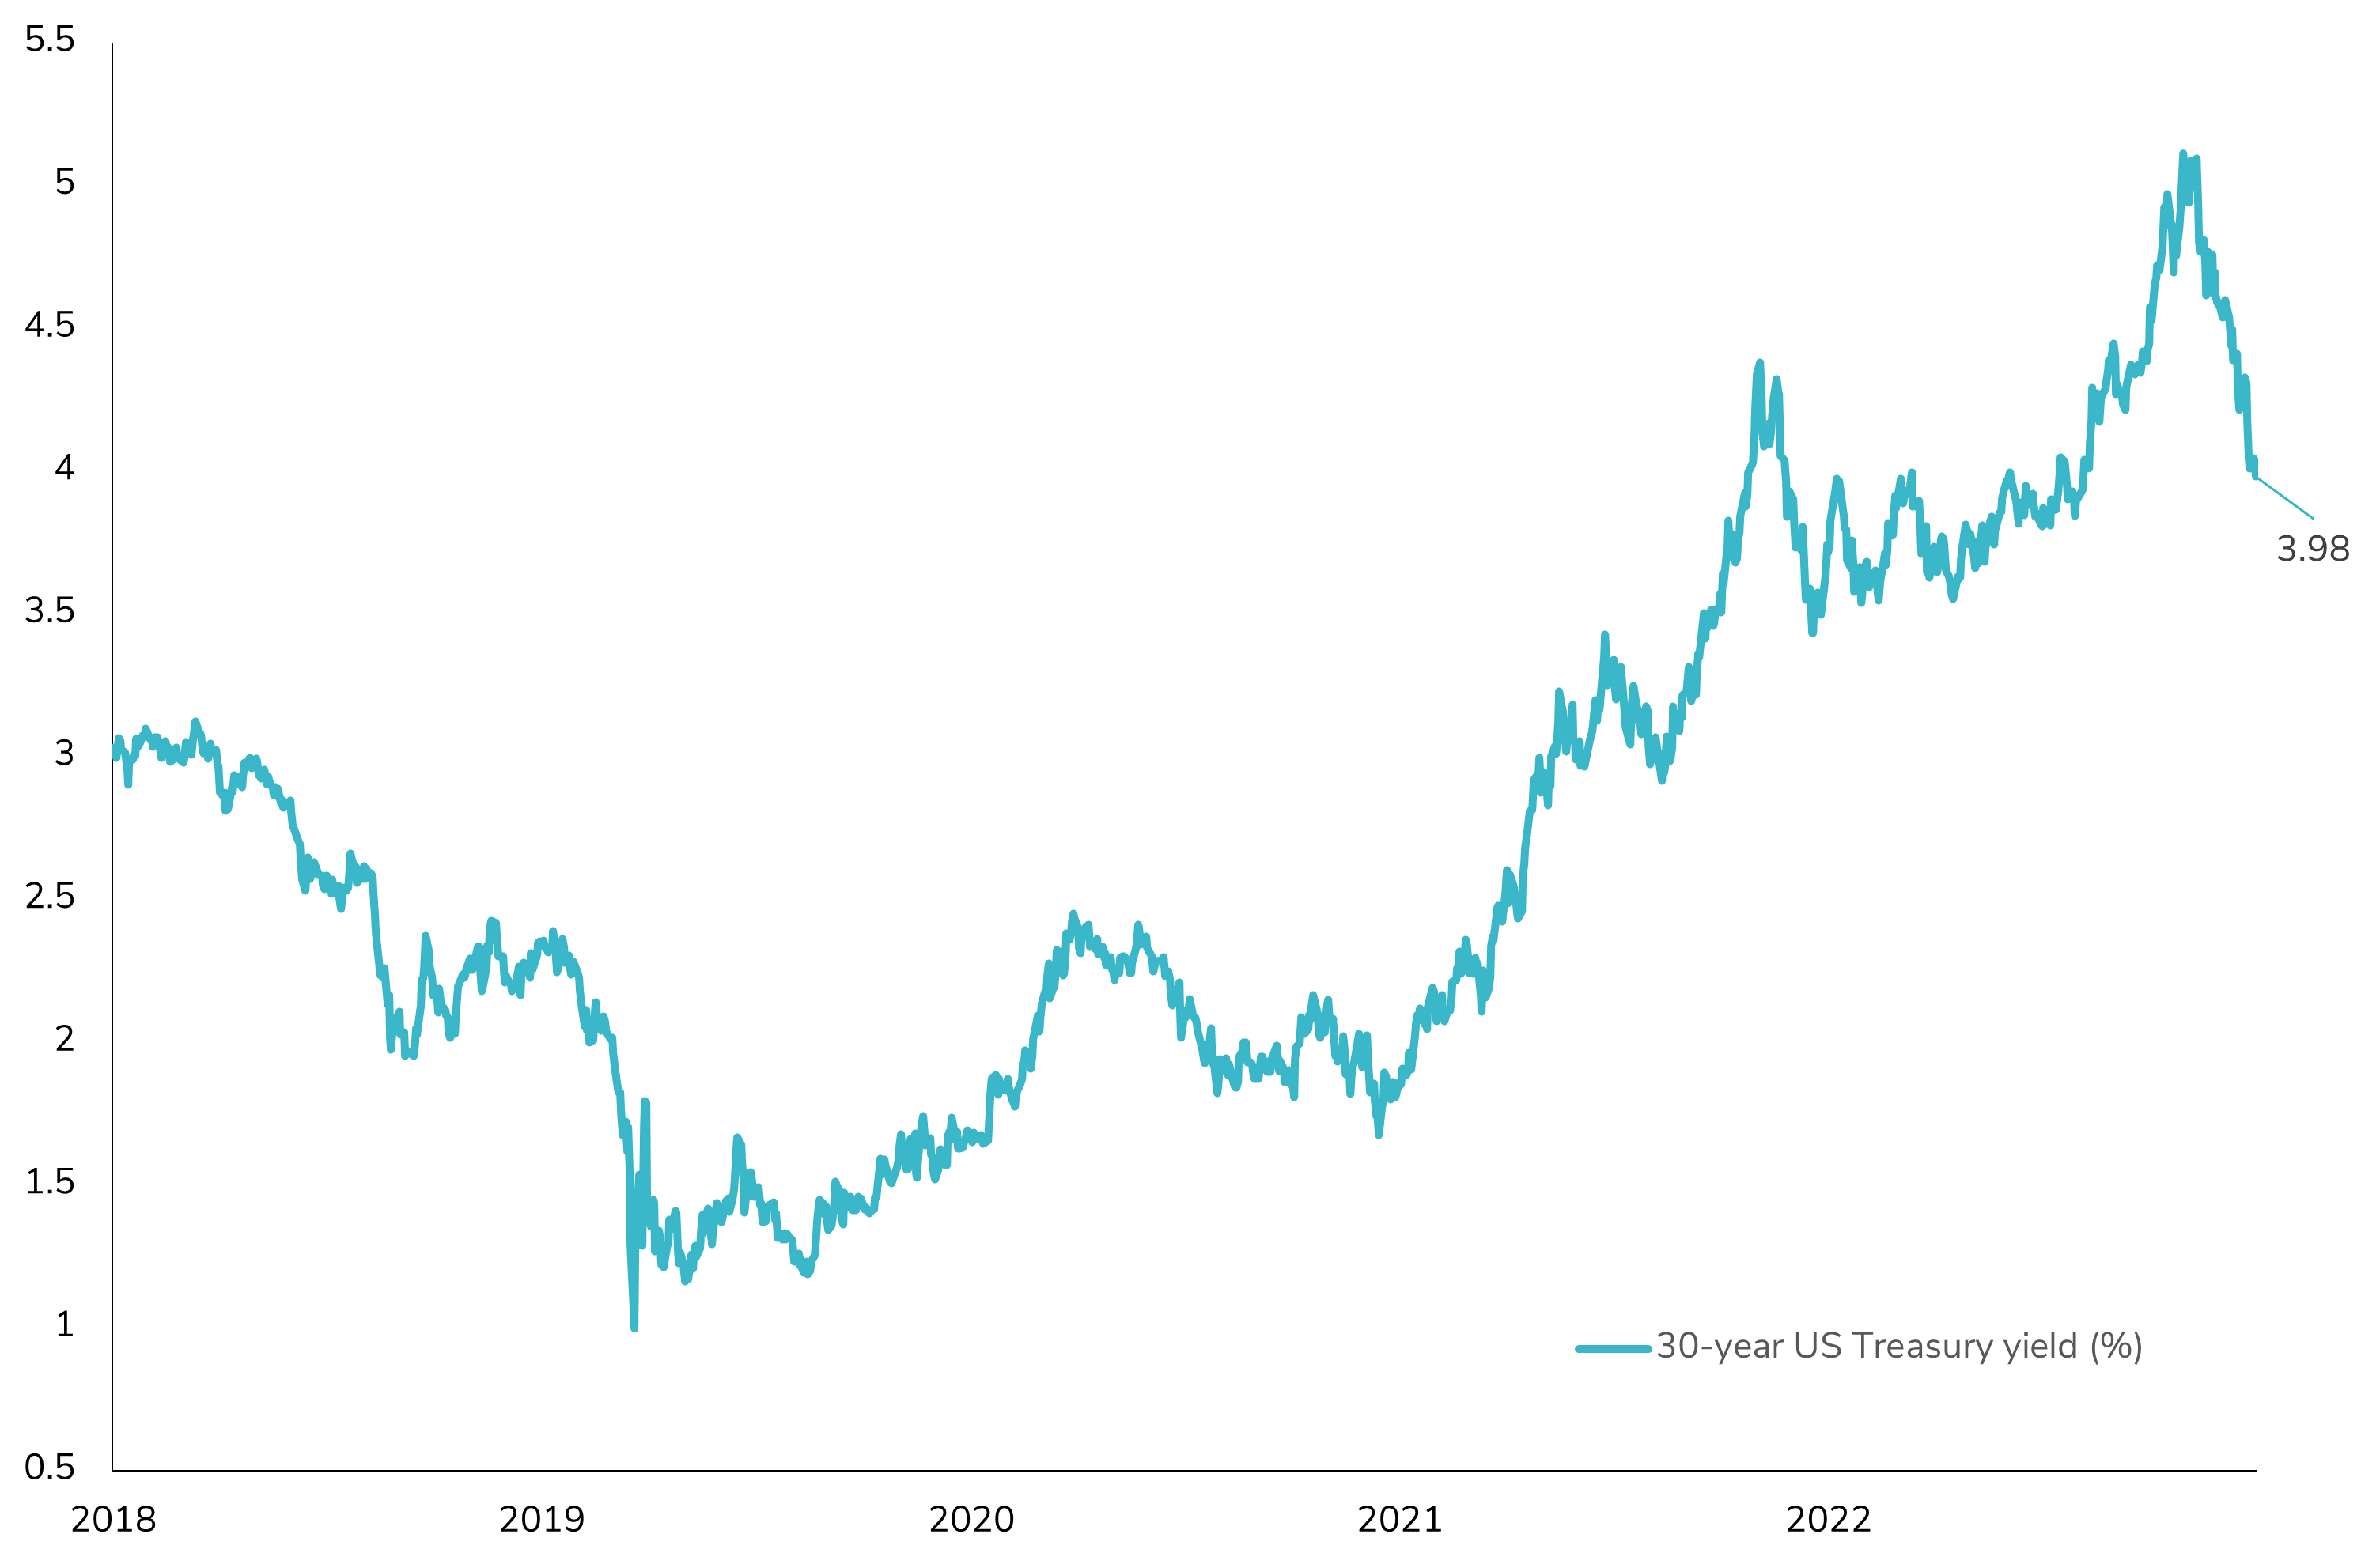
Going All-In on US Long-Term Bonds for 2024? 📈
In a recent Bank of America survey, when asked which asset would likely excel if the Fed cuts rates in H1'24, an intriguing 26% (earning the top spot) pointed to the Long 30-Year US Treasury. This raises an important question: Is this a sound strategy given the current economic climate? Notably, the preference for long-term bonds comes amid a significant drop in the 30-year US Treasury yield (>100 bps). However, the landscape is complicated by the anticipated heavy Treasury supply in the first quarter, alongside other factors. These include the uncertain economic repercussions of potential fiscal policies from the 2024 US election results (if Trump or another candidate favoring fiscal stimulus were to win), a negative US term premium, and an unusually persistent inverted yield curve in what appears to be a late economic cycle. Moreover, there's a critical consideration often overlooked: in scenarios of Fed rate cuts, the front-end of the yield curve, when adjusted for duration risk, might actually offer a more favorable position. So, is pouring resources into long-term bonds for 2024 a judicious move right now? Are long-term US bonds really the safe haven they’re perceived to be, or should we approach this strategy with a more critical lens? 🤔📊 #InvestmentStrategy #FixedIncome #FinancialMarkets"
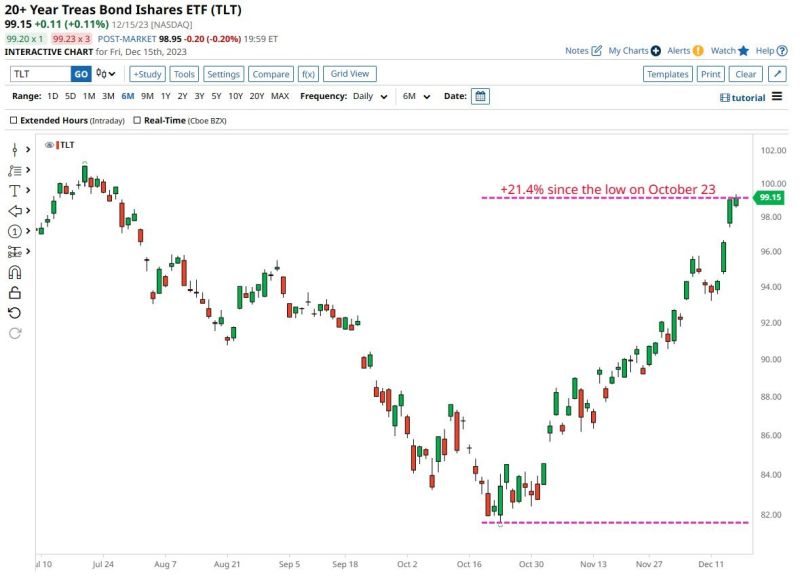
Long-Dated Treasuries have officially entered a bull market after $TLT surged higher by more than 20% from the 16-year low it hit on October 23
Source: Barchart
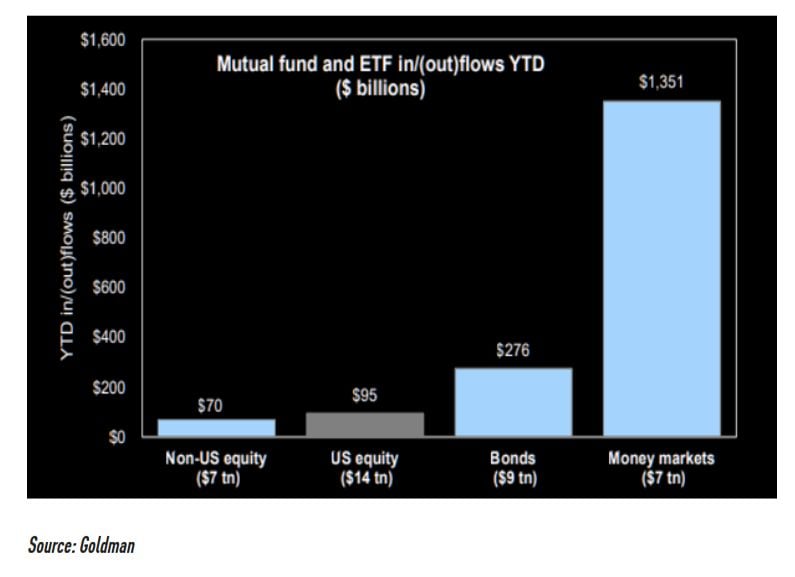
There is significant dry powder on the side line...
In 2023, we saw very limited US equity inflows vs. $1.4 trillion in money market inflows. If the gap starts to close for real now and gains momentum in 2024 it is needless to say a very good support for equities. Source: Goldman
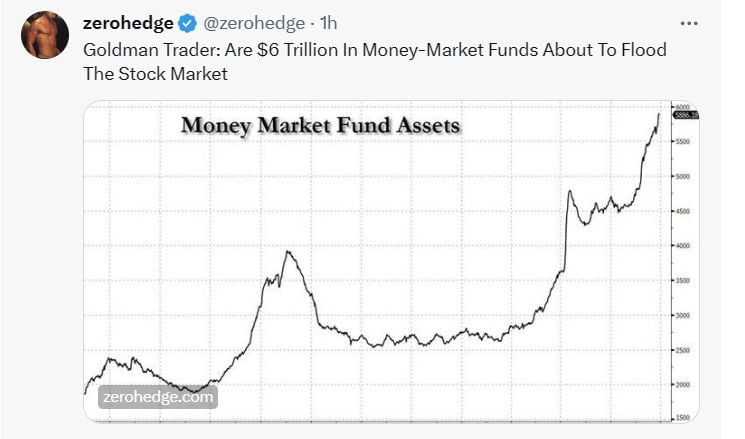
Goldman Trader: Are $6 Trillion In Money-Market Funds About To Flood The Stock Market
.
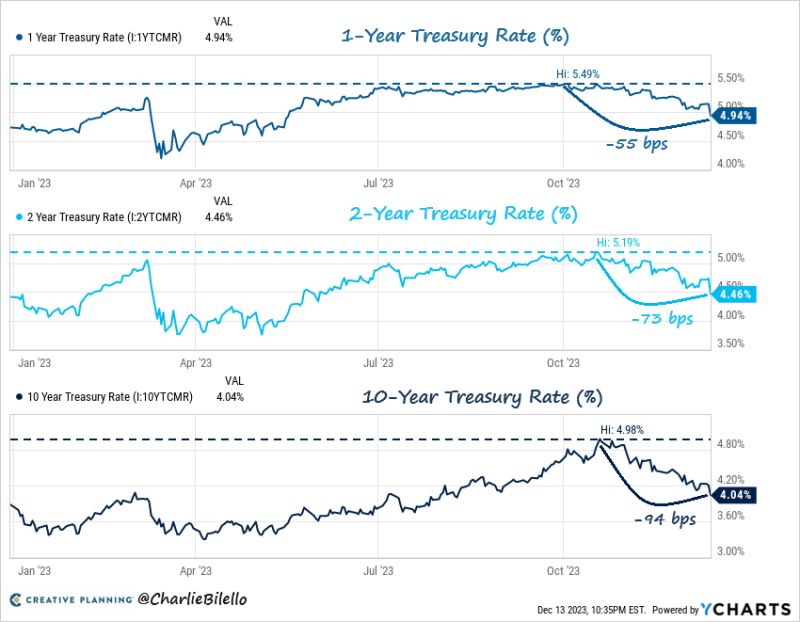
Big move down in Treasury yields yesterday after the FED projected 75 bps of rate cuts in 2024...
1-Year: 4.94%, down 55 bps from Oct high. 2-Year: 4.46%, down 73 bps from Oct high. 10-Year: 4.04%, down 94 bps from Oct high. Source: Charlie Biello
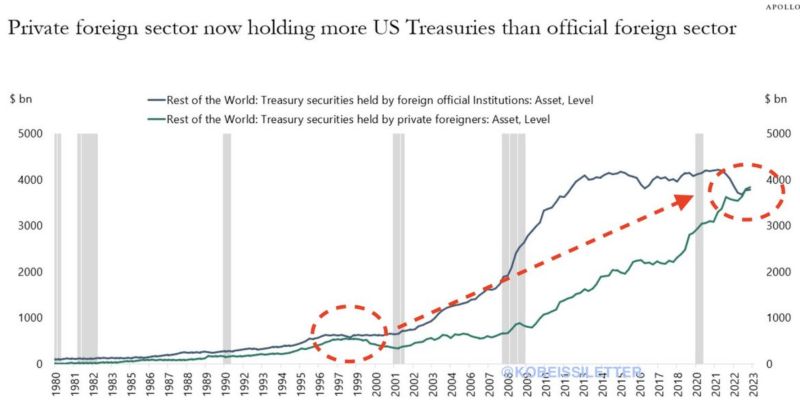
Who owns US Treasuries? For the first time since 1998, the private foreign sector now holds more US Treasuries than the official foreign sector
For 25+ years, the biggest foreign holders of US Treasuries were central banks around the world. However, this has now changed. reasons? QT but also foreign central banks buying less US Treasuries. Meanwhile, yield starving private investors keep accumulating US Treasuries. Source: Apollo, The Kobeissi Letter
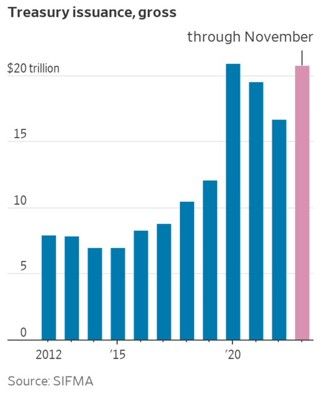
HEAVY SUPPLY REMAINS AN ISSUE FOR US TREASURIES
The US Treasury is selling $108 billion of 3-year, 10-year and 30-year bonds on Monday and Tuesday, along with $213 billion of shorter-term bills. This year’s Treasury sales are poised to surpass the record set in 2020. Source: Lisa Abramowitz, WSJ