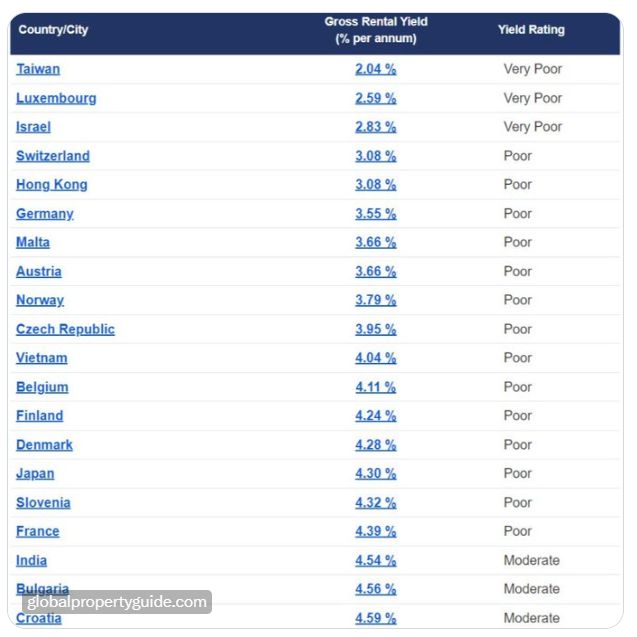
Global Property Guide
Q2 2023 gross rental yields for apartments/condos in over 250 cities across 60+ countries: Dublin: 7.70% Istanbul: 6.21% Dubai: 6.13% Warsaw: 6.02% Madrid: 5.27% Athens: 5.25% Amsterdam: 5.00% Singapore: 4.78% Vienna: 3.29% Zurich: 3.11% Hong Kong: 3.08% Source: https://lnkd.in/eTaAkcHM
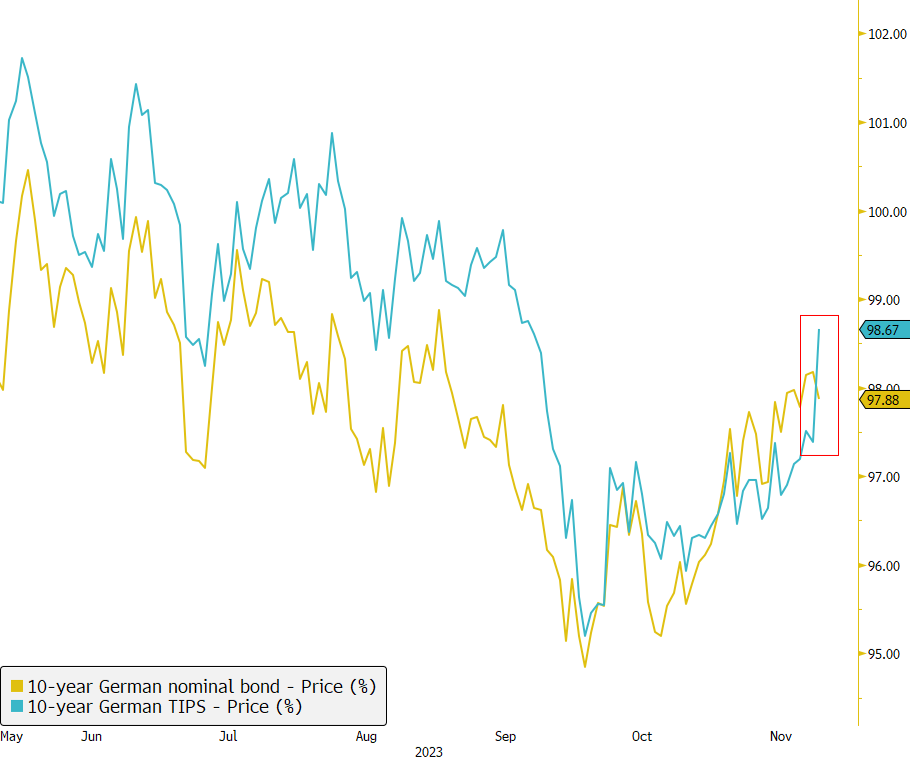
Market Moves: 10-Year German Inflation-Linked Bond Surges
Today witnessed a significant market shift as the 10-year German inflation-linked bond surged by more than 1%, juxtaposed with a 0.5% drop in the 10-year German nominal yield. This move can be attributed to the recent announcement from the German Federal Government to cease sales of inflation-linked bonds starting from 2024. Additionally, Germany's Lindner announced today to suspend the debt limit (#debtbrake) for 2023 following a budget ruling. Source: Bloomberg
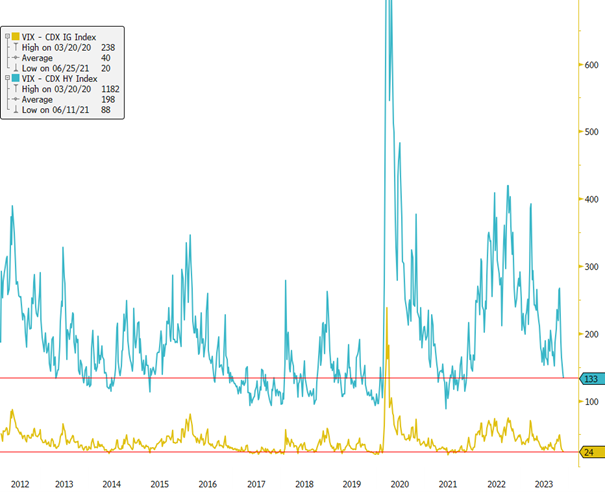
Record-Low Volatility in the US Credit Market! 📉🌐
Amidst ongoing rate volatility (MOVE index) showing a persistent high, albeit with a decreasing trend over the past two months, the volatility in credit markets has taken a different turn. Currently, volatility in US Investment Grade (IG) corporate bonds has reached levels not seen since 2021, hovering close to record lows. Additionally, the volatility in US High Yield (HY) has experienced a significant drop in the past month. With low volatility and tight credit spreads, the question arises: Is there still room to extract excess returns from the US credit market in 2024? 🤔 Source: Bloomberg #CreditMarkets #Volatility #FinanceInsights
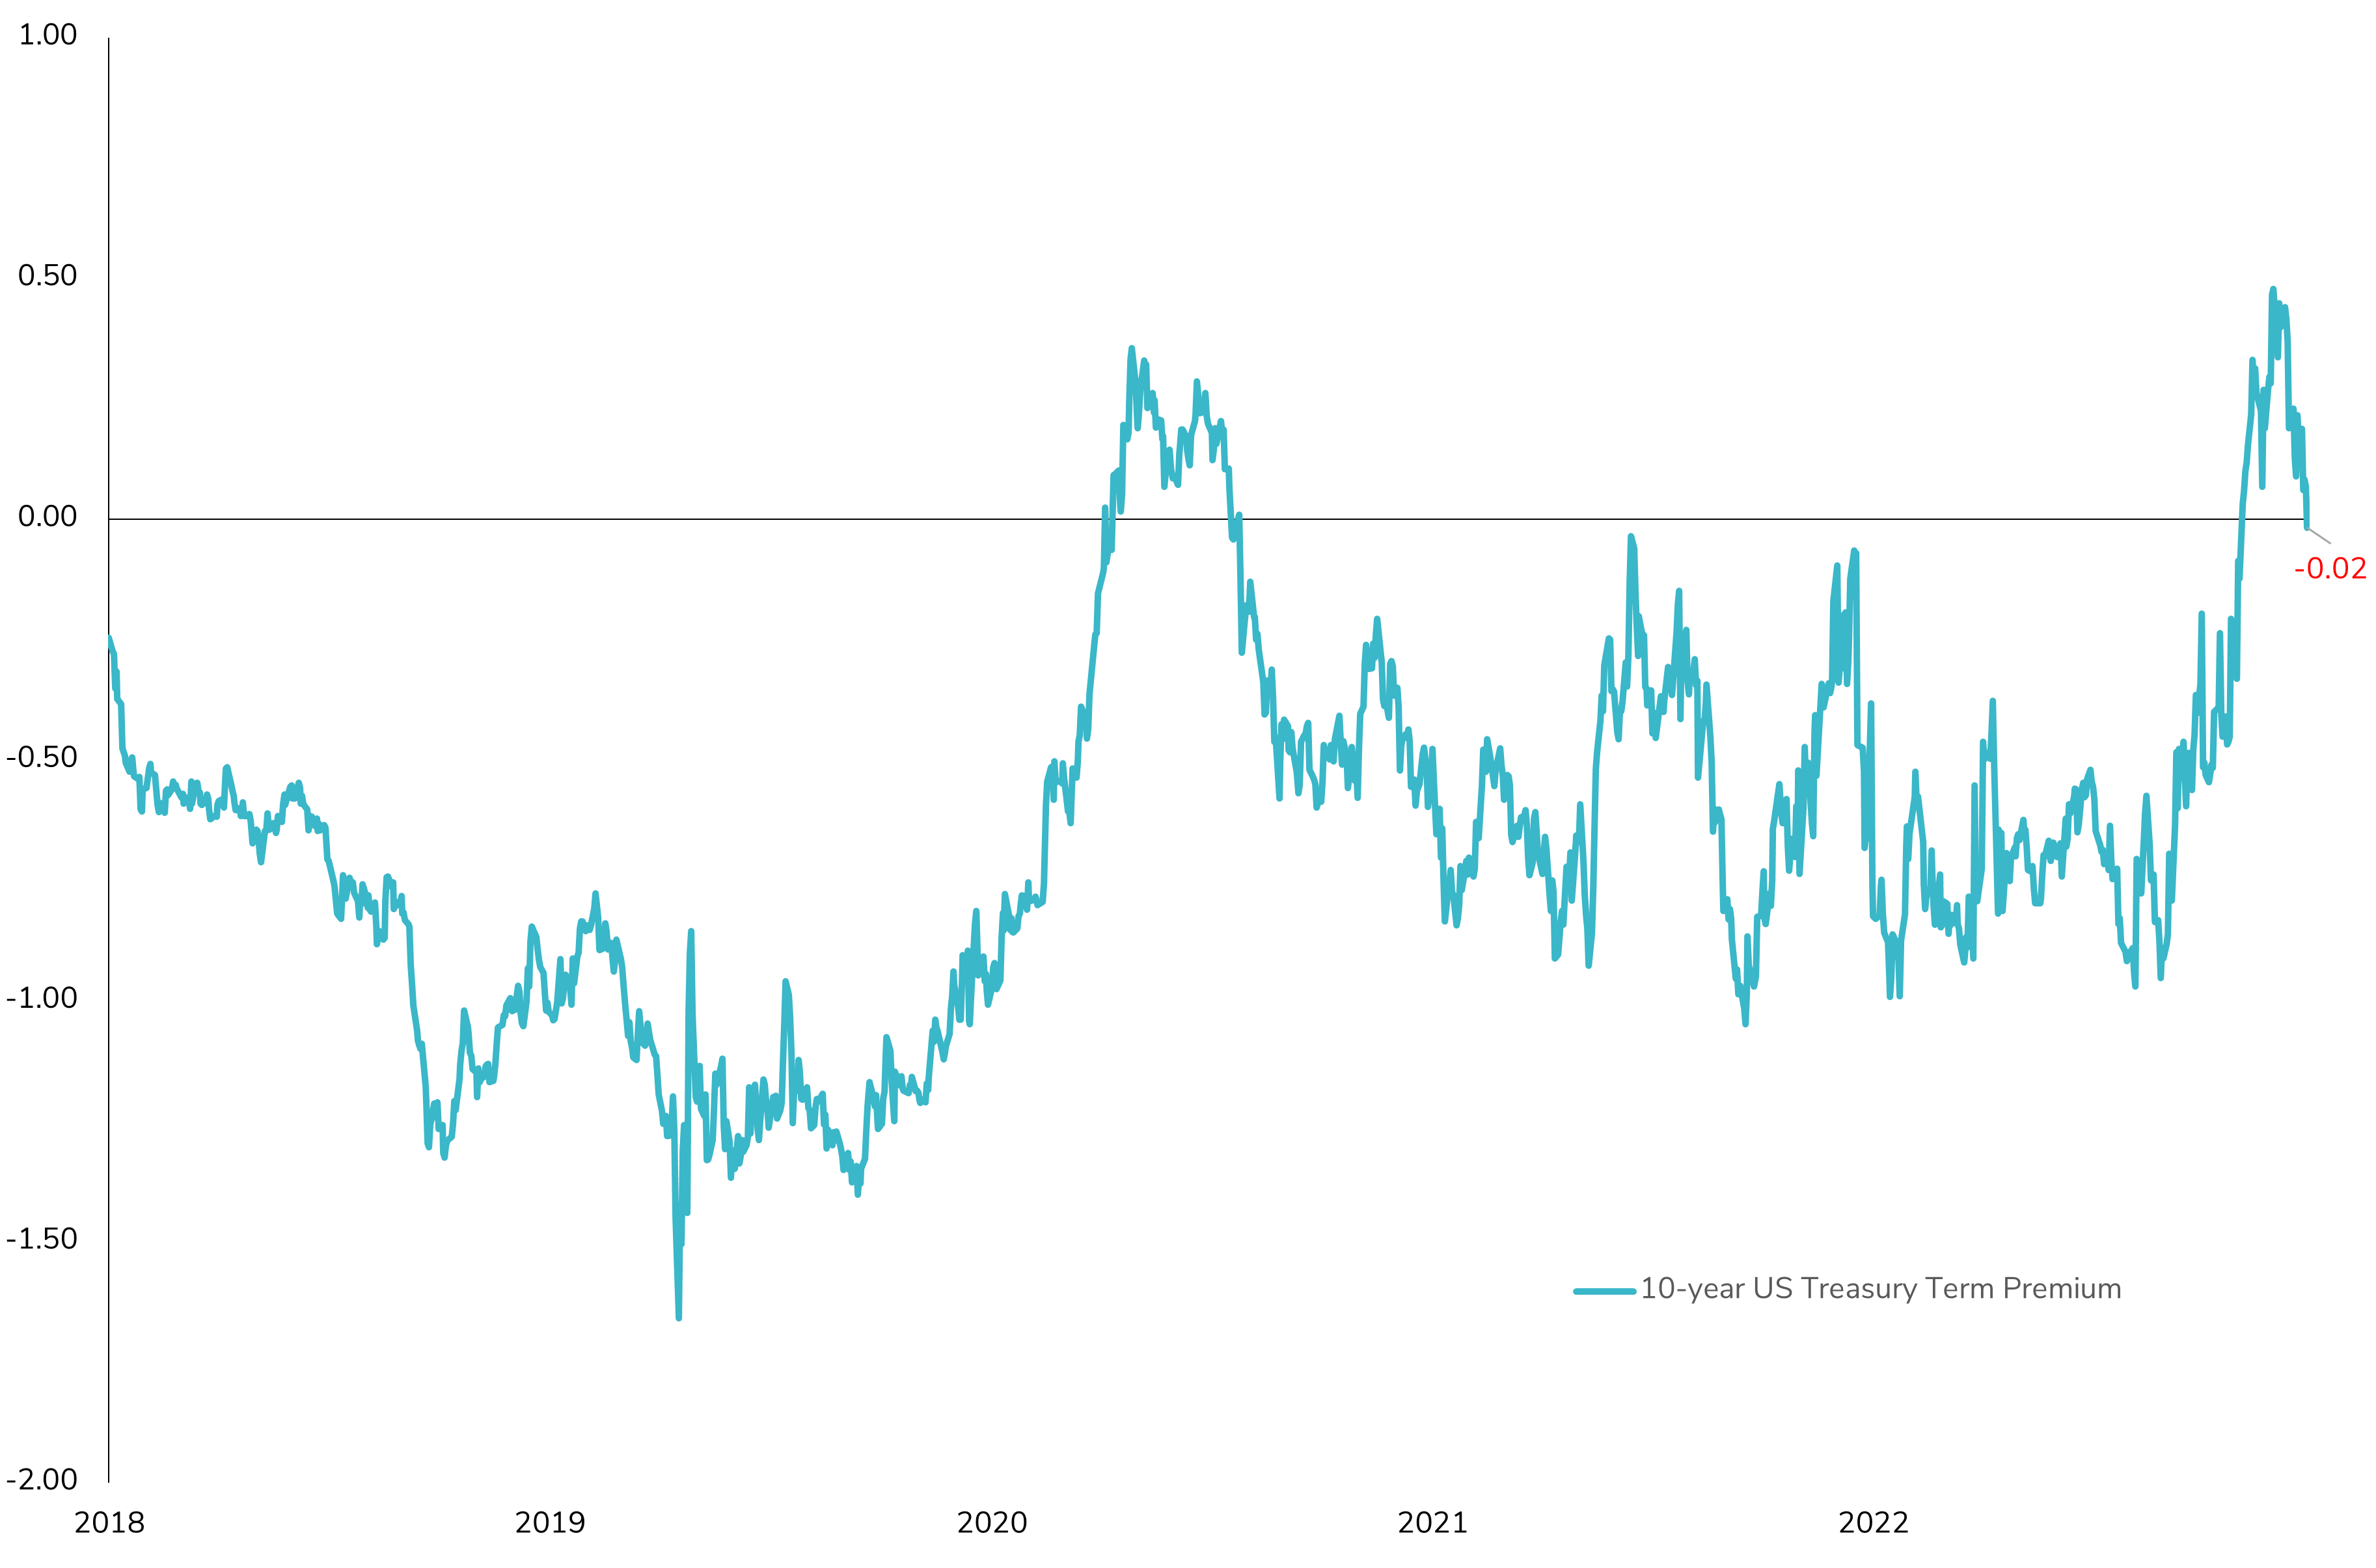
10-Year US Term Premium Dips Back into Negative Territory! 📉🔍
The term premium, a metric reflecting the additional yield demanded by investors for holding longer-term bonds rather than rolling over shorter-dated securities, turned negative last week. This shift could be interpreted as a signal that the market is anticipating a recession in the US in 2024, with rate cuts by the Federal Reserve (1% fully discounted already by the market). Given the recent rally of more than 50 basis points on the 10-year US Treasury yield and the term premium now in negative territory, coupled with still very high rate volatility, the question arises: Will the rally in long rates temporarily come to a halt? 🤔 Source: Bloomberg
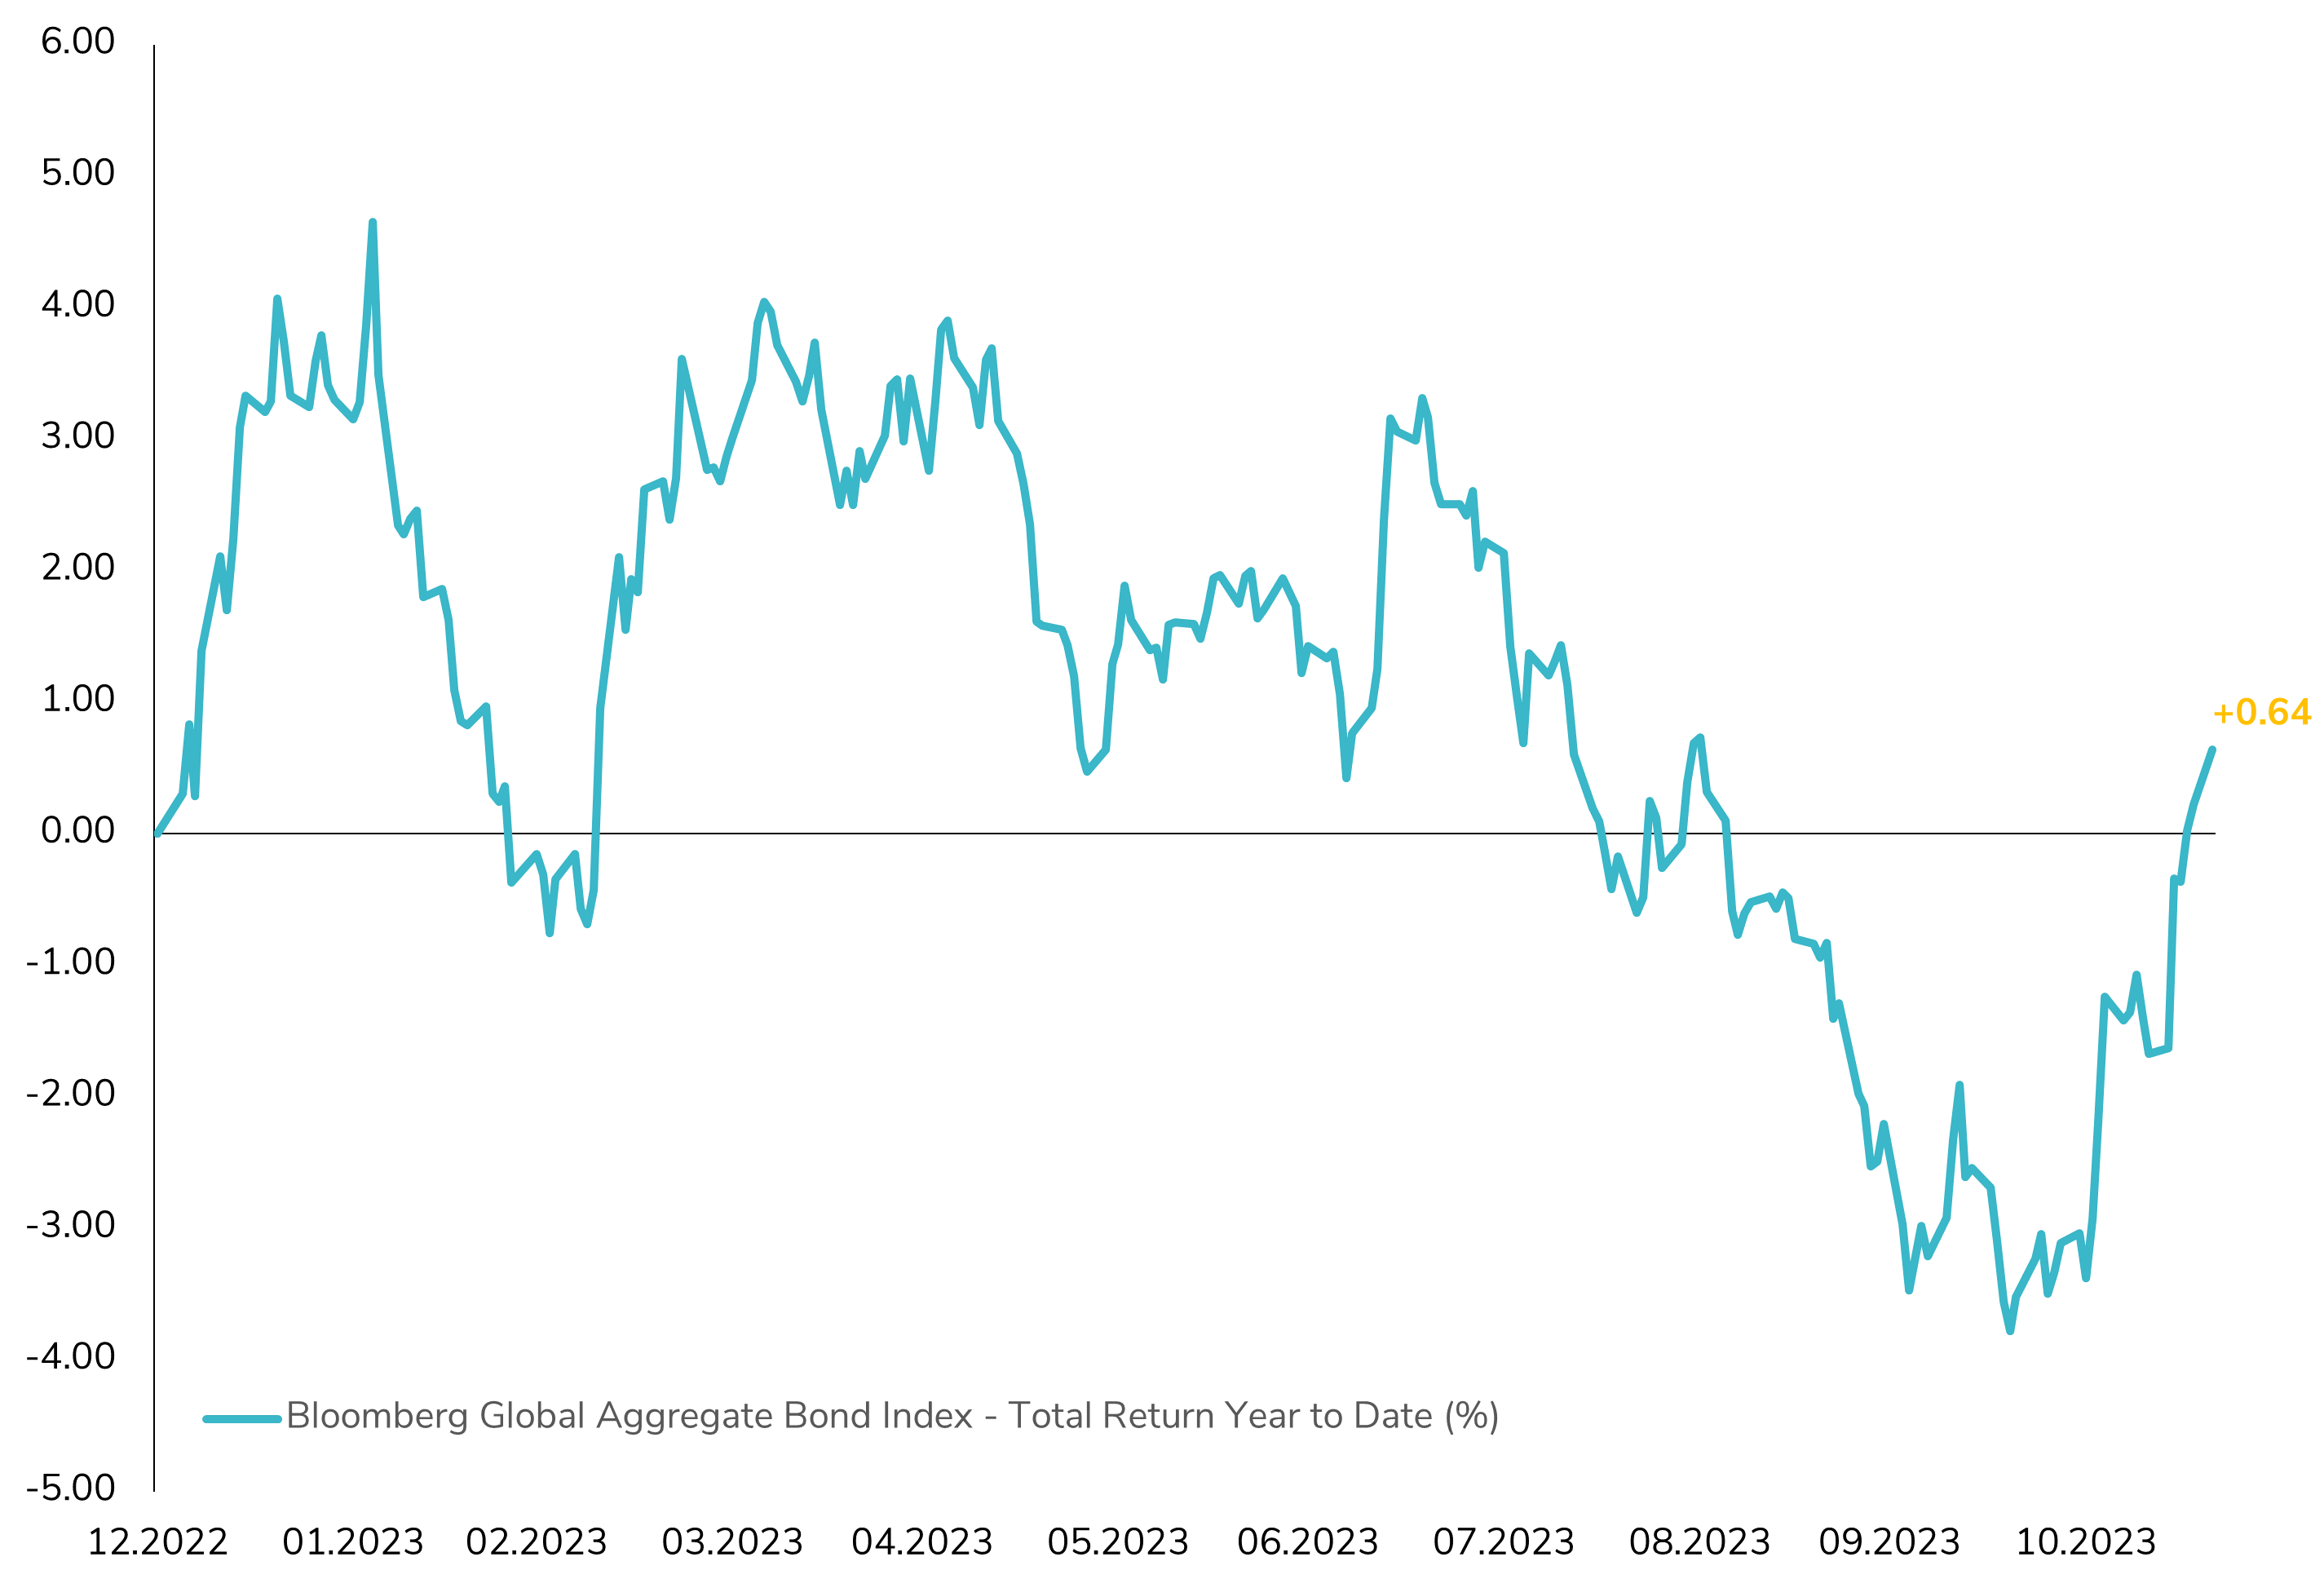
The Global Fixed Income Landscape Regains Its Color! 📈🌐
After a dip to -4% year-to-date just a month ago, the global fixed income investment universe is now on a sharp rebound, driven by improving inflation signals hinting at a potential rate peak by central banks (already materialized in some emerging market countries). The Bloomberg Global Aggregate Bond Index, a widely tracked and comprehensive global bond indicator, has returned to positive territory in 2023 since last week. This upturn signifies a positive development for fixed income investors who have navigated challenges over the past three years, with a cumulative total return of -20% since the end of 2020. Are we entering a sunnier future for fixed income investments? ☀️ Source: Bloomberg
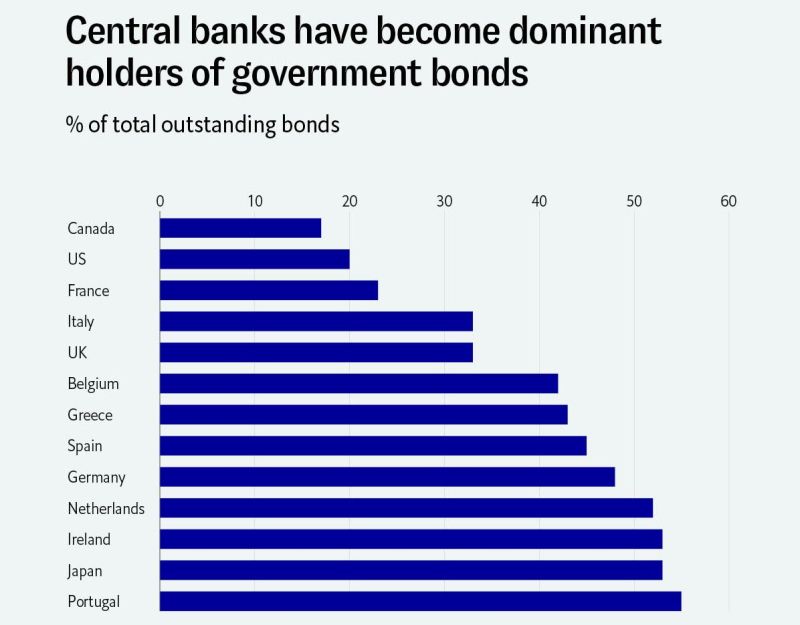
central banks have become dominant holders
Source: Michel A.Arouet
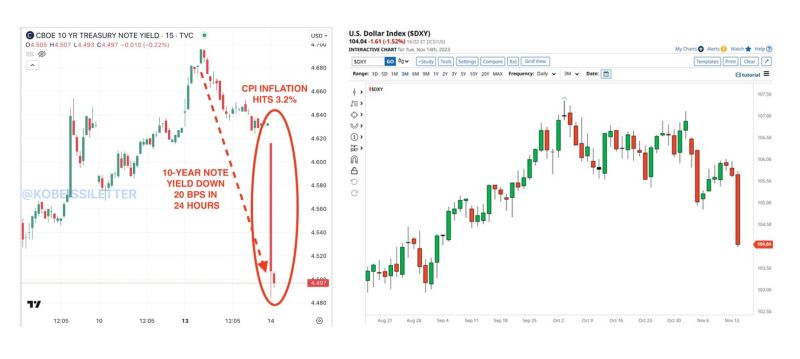
What a day...
The US 10-year note yield fell sharply to 4.49%, after CPI inflation hits 3.2% in October. The 10-year note yield went down 20 basis points in 24 hours. Meanwhile, the U.S. Dollar Index $DXY had its biggest drop in more than a year. Source: The Kobeissi Letter, Barchart
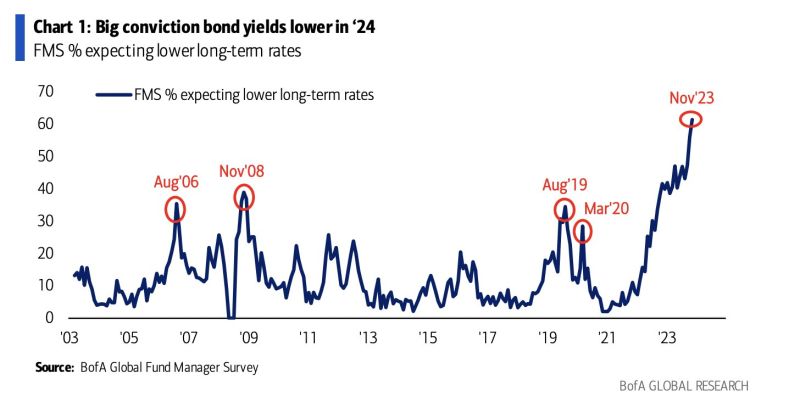
Looks like it will be one of the most crowded trades to come
61% of Fund Managers from BofA Fund Manager survey expect lower bond yields, most on record, despite 2nd highest ever saying fiscal policy is too stimulative. Source: BofA, HolgerZ