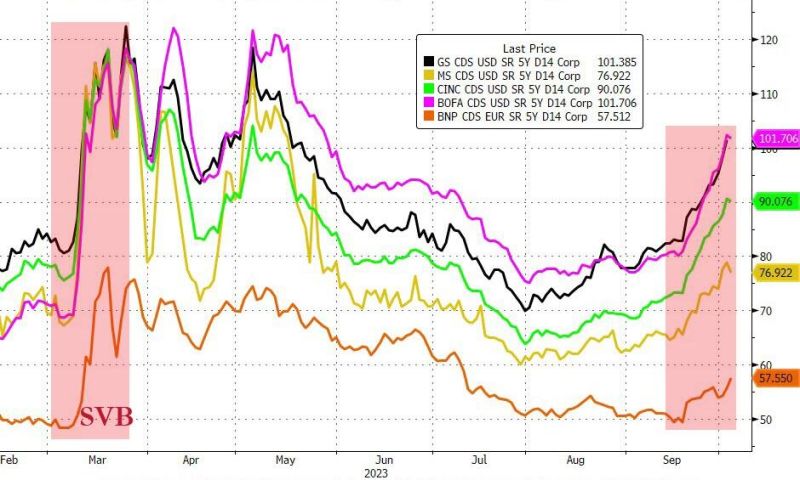
CDS traders are sending default swaps on the big US BANKS sharply wider
- Deutsche Bank believes the rise in yields could propel Banks' Unrealized losses $140 Billion higher to a record $700 Billion. DB strategist Zeng warns the Q3 explosion in rates has no doubt widened the unrealized losses in US banks bond portfolios, which was already the catalyst for multiple bank failures this year at a time when #rates blew out to far more normal levels.
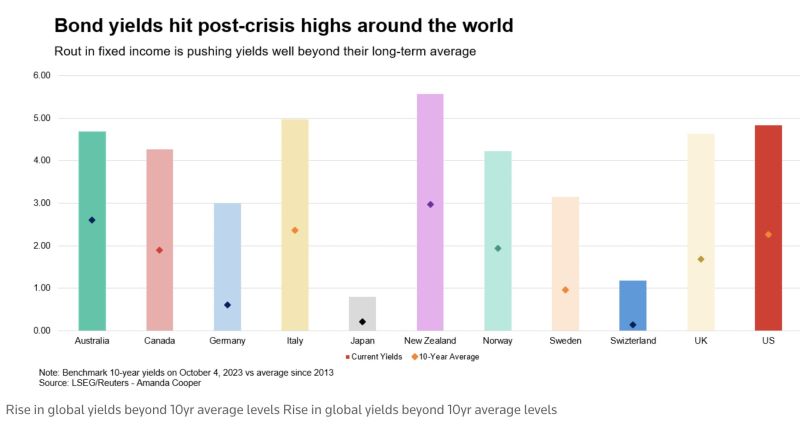
The global bond markets rout in one chart
The world's biggest bond markets hit by heavy selloff: Bond yileds hit post-crisis highs around the world: US 30y yields hit 5% before retreating. German bund yields hit 3%. Bond rout sounds alarm bells globally. Source: HolgerZ
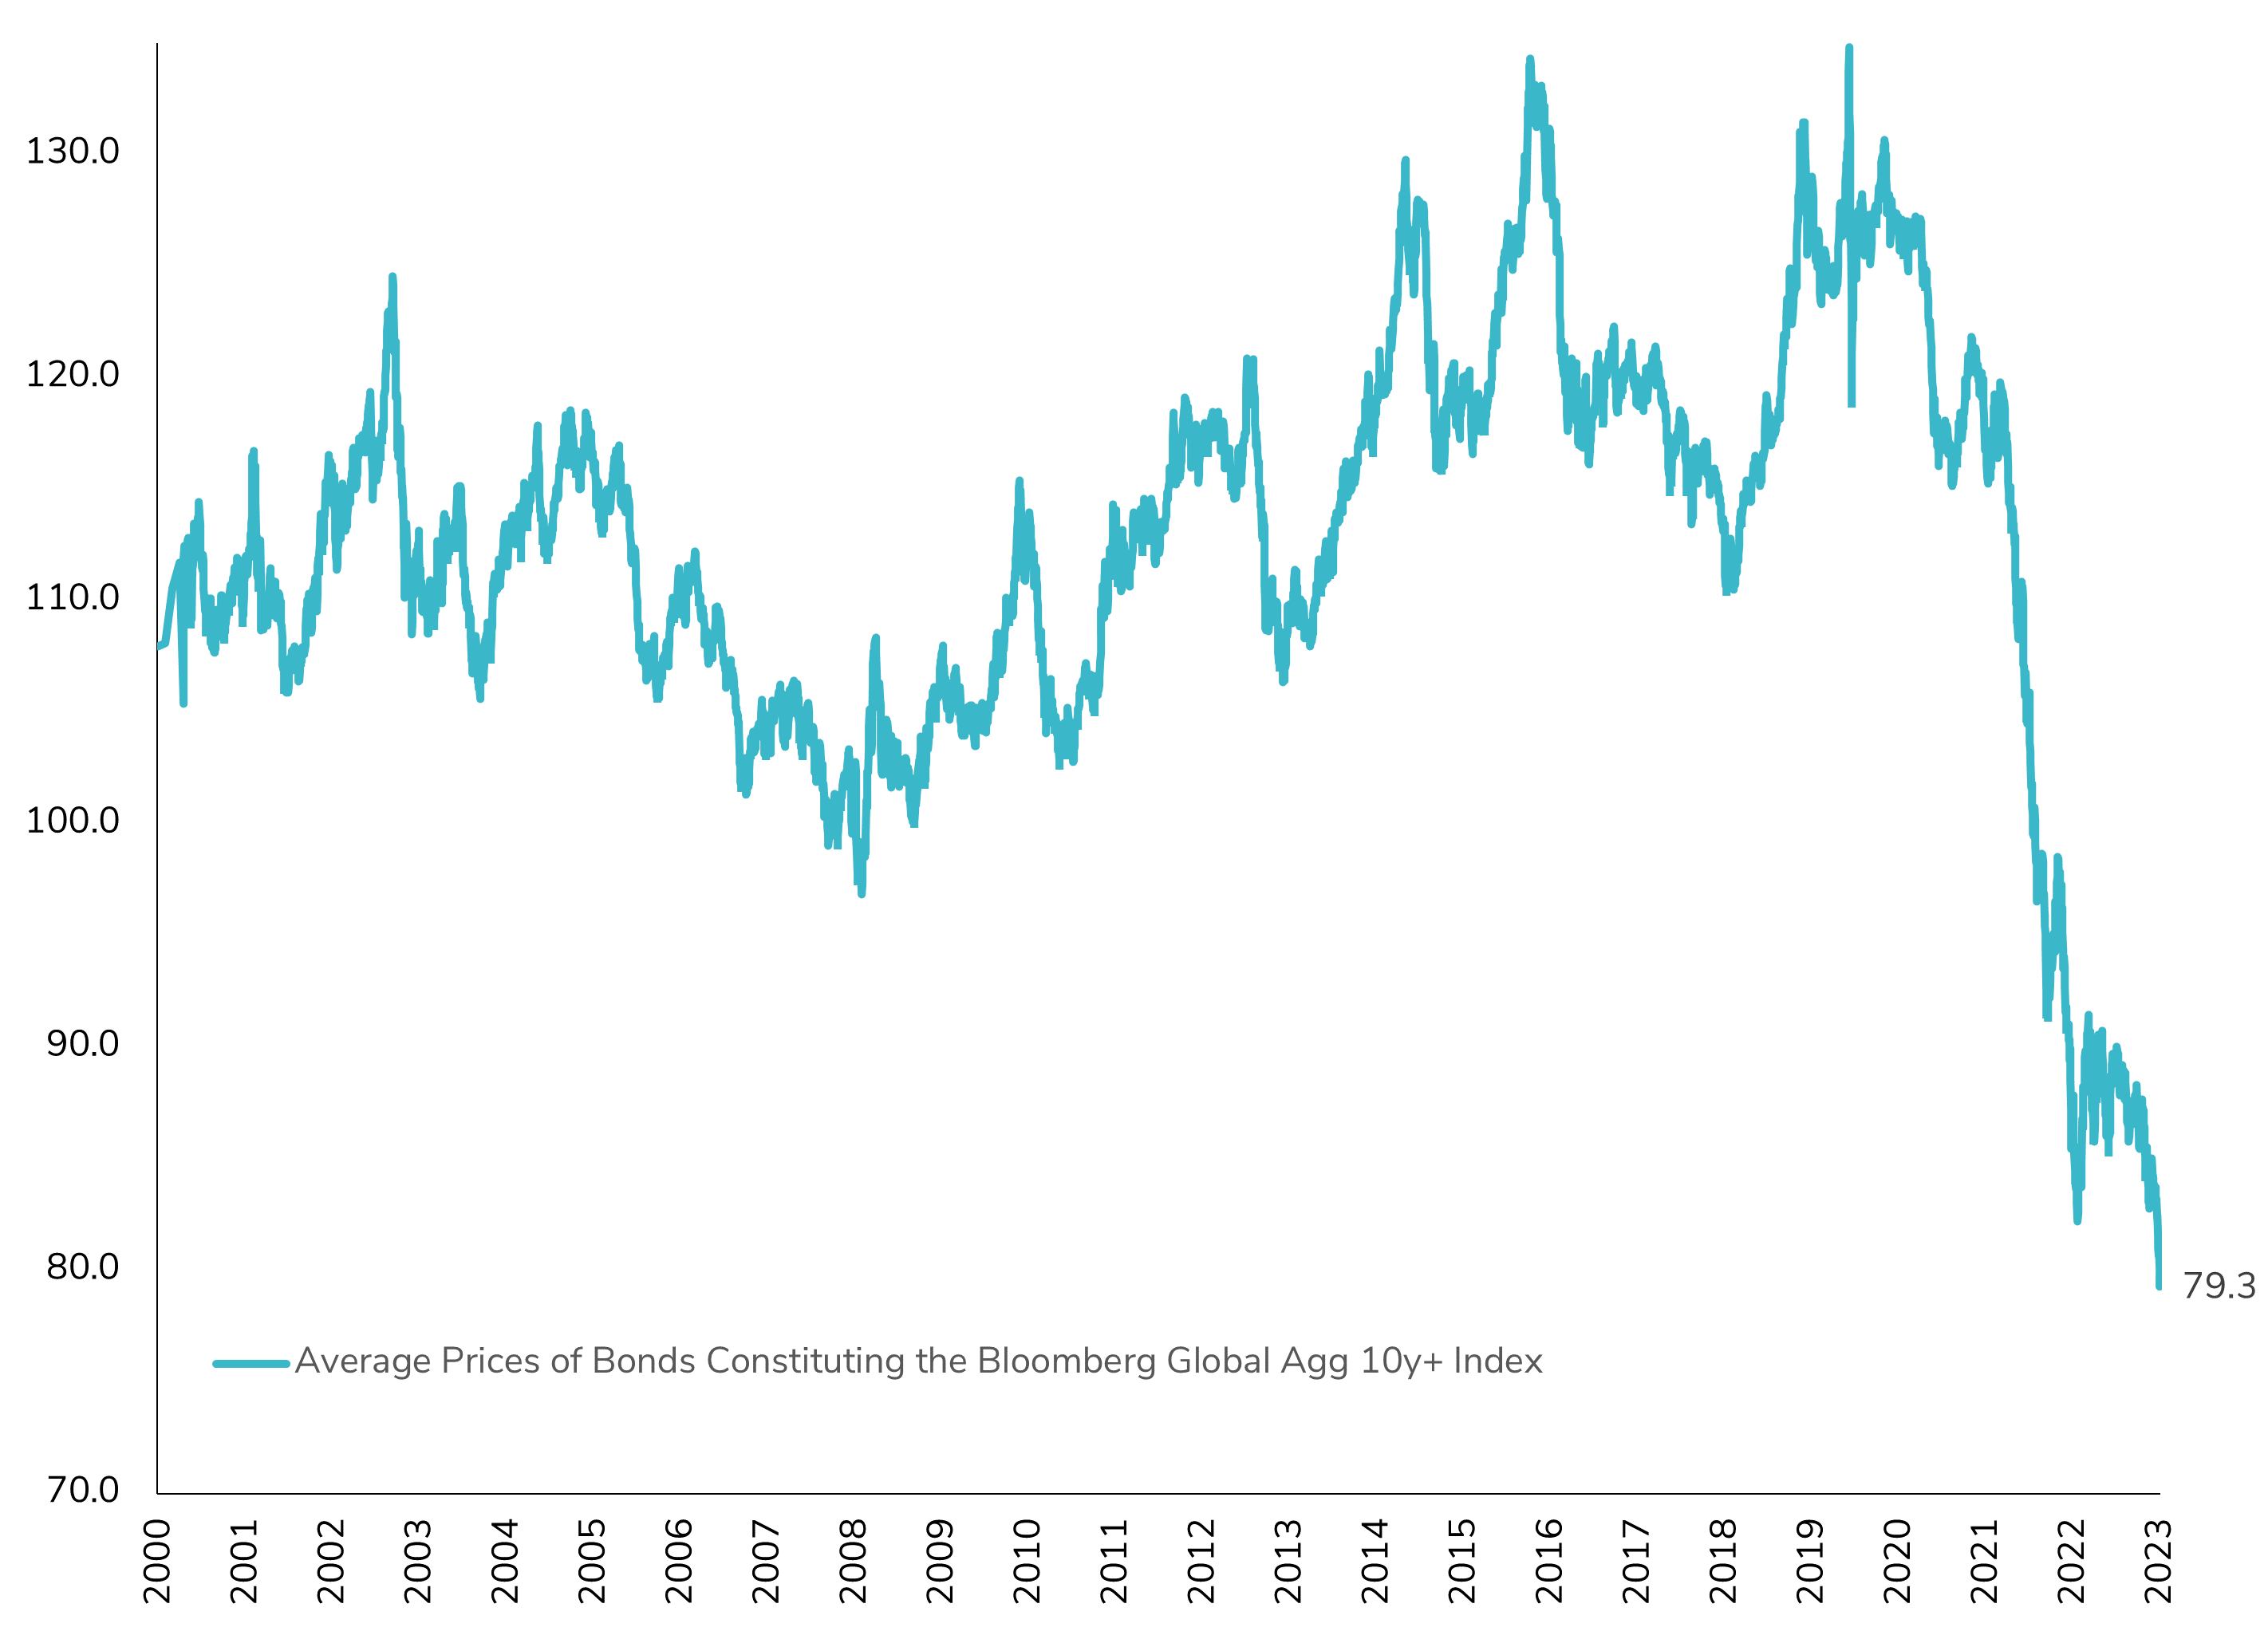
Long-Term Bond Prices Hitting Historic Lows in Global Aggregate Bonds Index: A Cautionary Tale of Convexity?
The average price of long-term bonds has recently reached historic lows, a significant development since the inception of the Bloomberg Global Aggregate Bonds Index in the early 2000s. If the "higher for longer" narrative materializes and persists, it carries substantial implications for bond investors, especially those with long-term bond holdings. This pertains to the convexity of long-term bonds, a crucial yet often underestimated aspect of fixed-income investments. Choosing to retain long-term bonds with reduced prices and the associated lower coupon payments may lead to overlooking the attractiveness of short-term bonds, which currently offer more technically appealing yields. This decision could potentially entail a nuanced opportunity cost in the short term, especially if the 'higher for longer' scenario (which implies a soft landing) persists. Source : Bloomberg
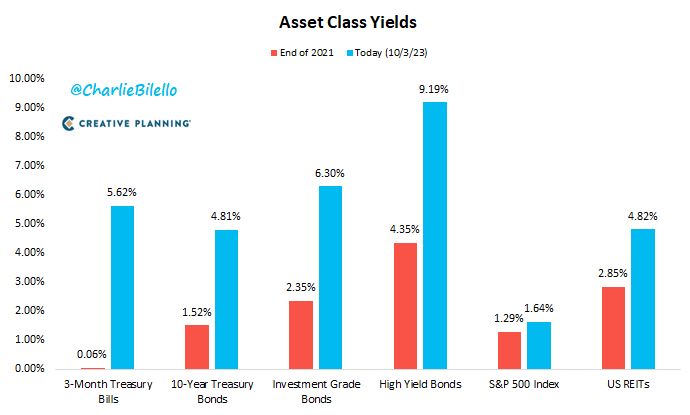
A lot has changed over the last two years...
Source: Charlie Bilello
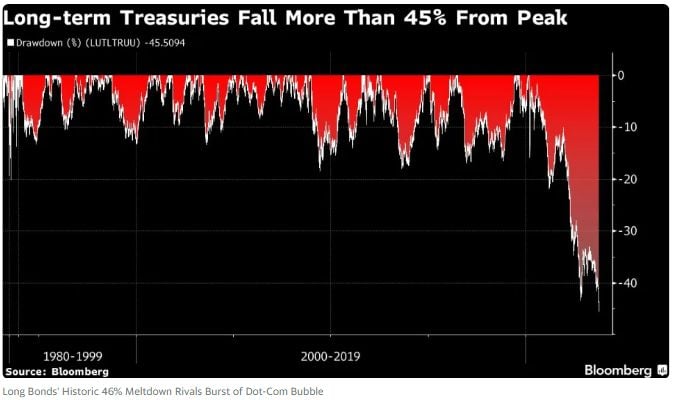
10-Year Treasuries have declined 46% from the peak in March 2020 which is among the greatest meltdowns in financial history including the 49% drop in equities during the Dotcom Bubble
Source: Bloomberg, Barchart
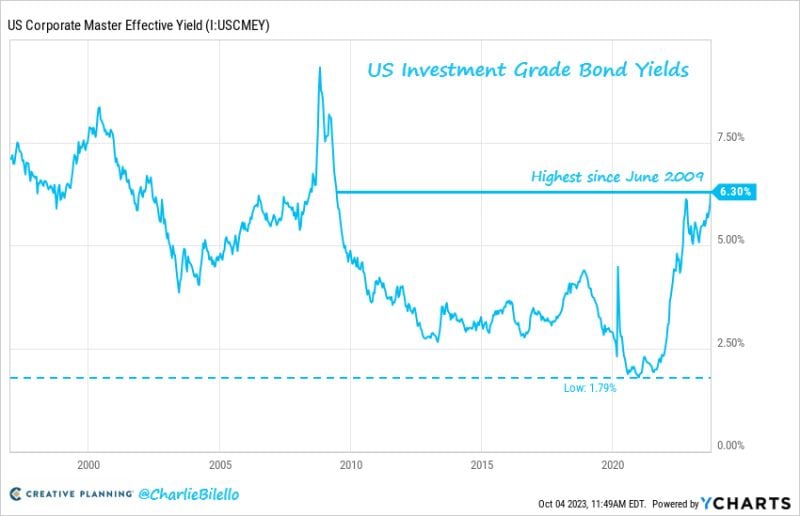
US Investment Grade bond yields have moved up to 6.3%, their highest level since June 2009
In early 2021 they hit an all-time low of 1.79%. A competition for stocks? Source: Charlie Bilello
Embrace the new normal…
Source: Nikolay Kolarov
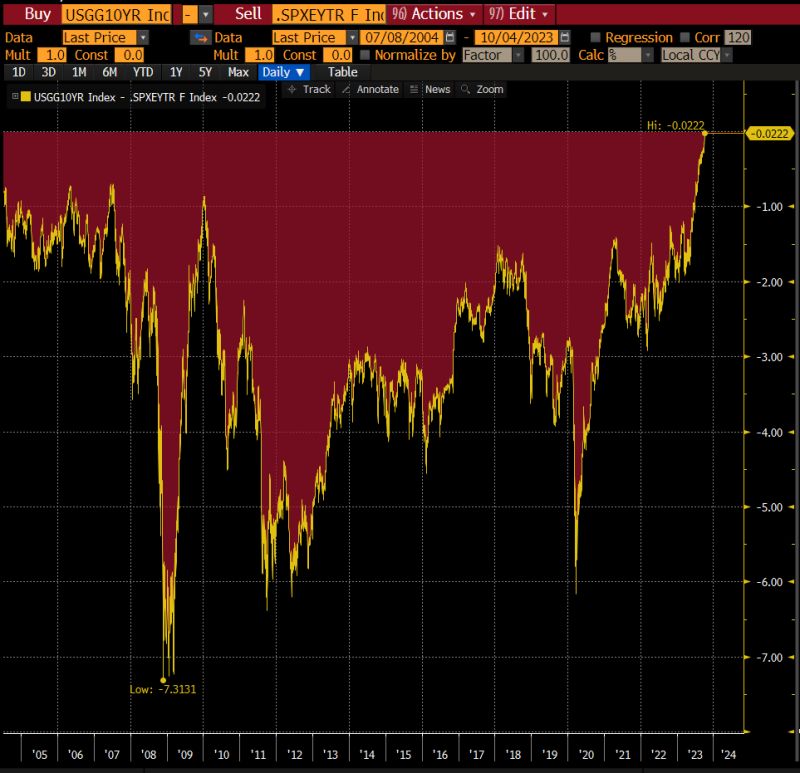
Yields on 10-year Treasuries are now almost equal to the trailing 12-month earnings yield on the S&P 500 index. This is the first time that's the case going back to 2002
Source: Bloomberg, Lisa Abramowitz