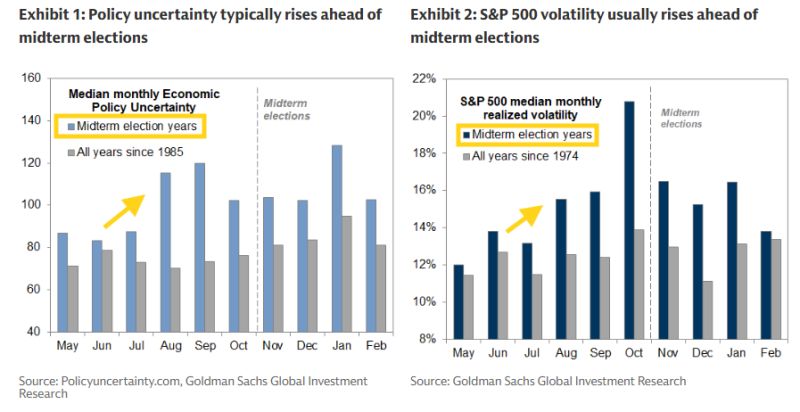
Goldman: With the 2026 midterms three months away, investor focus is likely to turn increasingly to elections in coming weeks. Midterm elections will take place this year on November 3.
During the last few decades, economic policy uncertainty and equity market volatility have typically begun to rise in the late summer ahead of midterm elections. Our economists have found the same pattern after adjusting for the economic cycle as measured by the unemployment rate. Source: Goldman Sachs, Neil Sethi on X
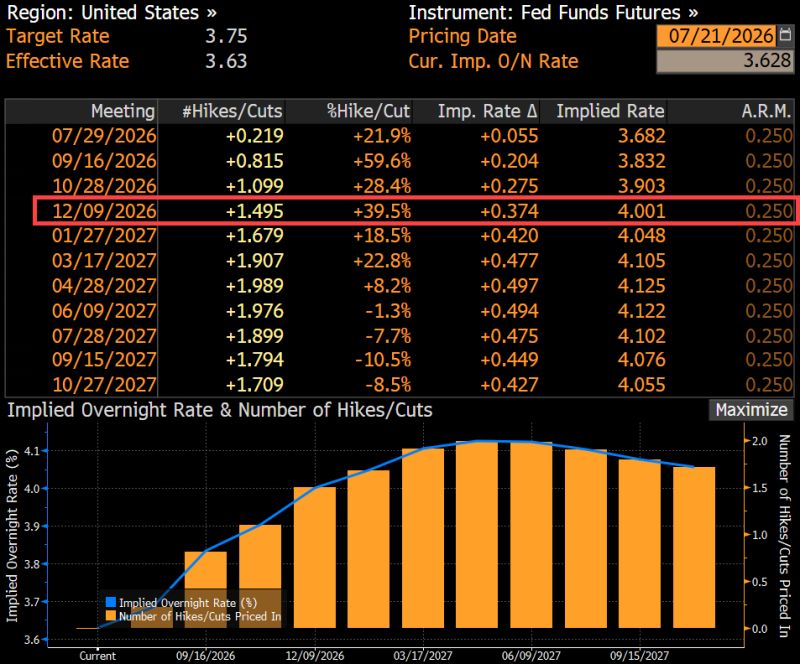
The futures market is now pricing 1.5 Fed rate hikes by year-end
Source: Hedgeye, Bloomberg
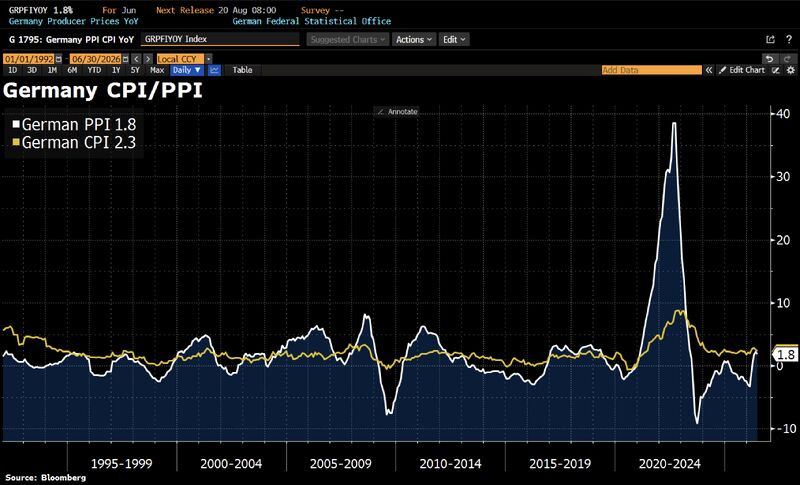
In Germany, factory-gate inflation offers a hopeful signal for consumers
Producer prices slowed to 1.8% YoY in June from 2.2% in May, below the June CPI of 2.3%, and fell 0.3% MoM. Crucially, German producers charged 2.2% less for consumer goods YoY, led by food prices down 4.5% YoY; a positive signal for retail inflation. Source: HolgerZ, Bloomberg
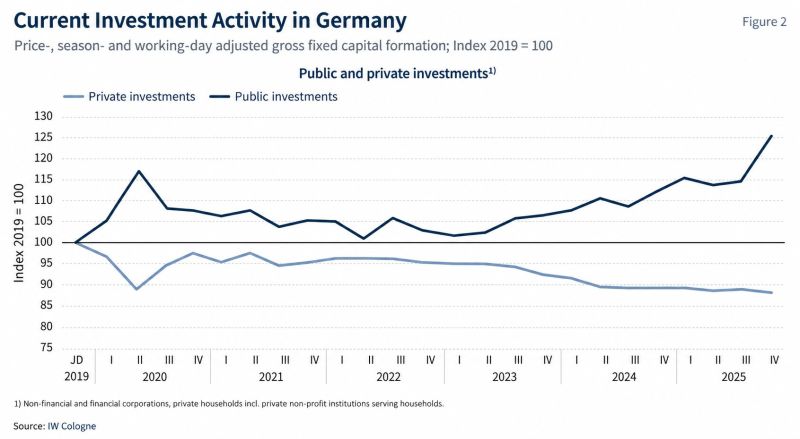
In Germany, the state is investing, but companies still aren’t.
Public investment has surged to 125% of its 2019 level, while private investment has fallen to 88%. One year after “Made for Germany,” corporate spending is rising, but far too slowly to hit the €631bn target by 2028. Germany is becoming more expensive without becoming more attractive. (HT CEO Table) Source: HolgerZ
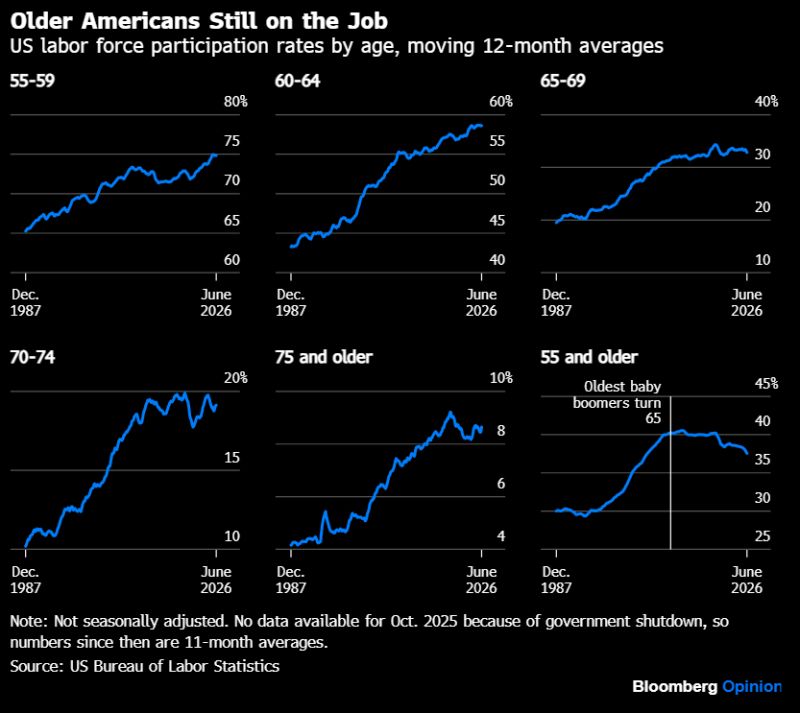
America isn't retiring anymore. It's working longer than ever.
One in three Americans aged 55 and older is still working or looking for work, and that share has been climbing for nearly 40 years. The biggest change is among older workers: • Ages 65–69: participation has nearly doubled since the late 1980s, now above 30%. • Ages 70–74: from under 10% to almost 19%. • Ages 75+: participation has doubled to roughly 8%. The numbers are striking. Nearly 11.9 million Americans aged 65+ were employed last year, more than double the level of three decades ago. Between 2015 and 2024, the 65+ workforce expanded 33%, while the overall labor force grew by less than 9%. Longer life expectancy is part of the story. But so are disappearing pensions, rising living costs, and Social Security benefits that no longer stretch as far. Retirement is increasingly becoming a luxury rather than the default. Source: hedgeye
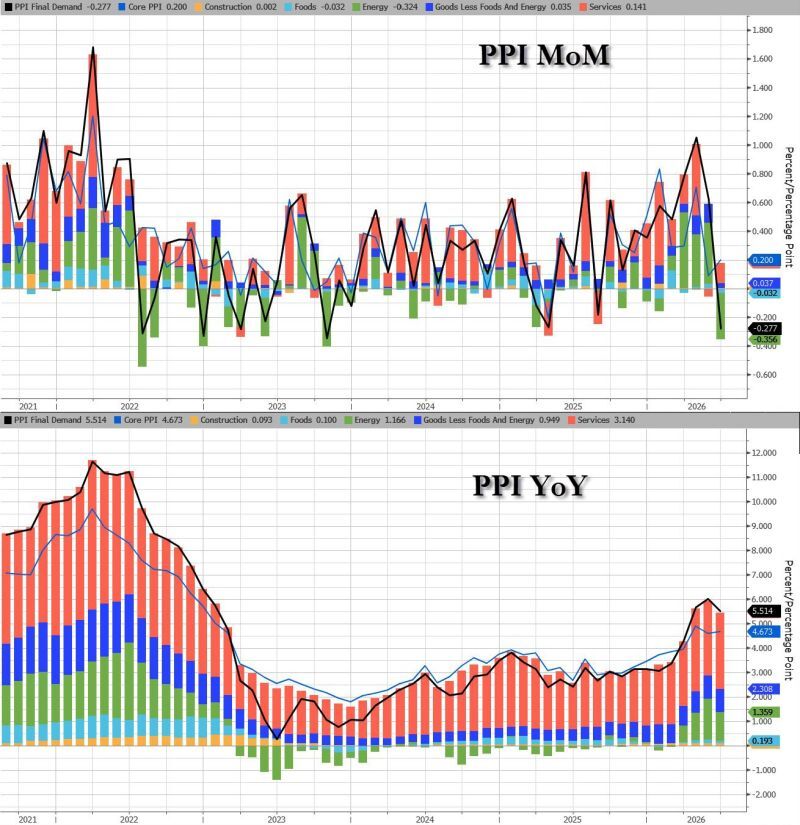
In case you missed it... Just like Tuesday’s CPI, US PPI inflation came in significantly softer than consensus forecasts, across the board.
Headline PPI moderated to 5.5% year-over-year (vs. 6.2% expected), driven by a -0.3% monthly decline (vs. 0.0% expected) The core rate fell to 4.7% yoy (on a 0.2% monthly increase). These much better-than-expected figures are set to further temper market expectations for upcoming interest rate hikes. Source: zerohedge
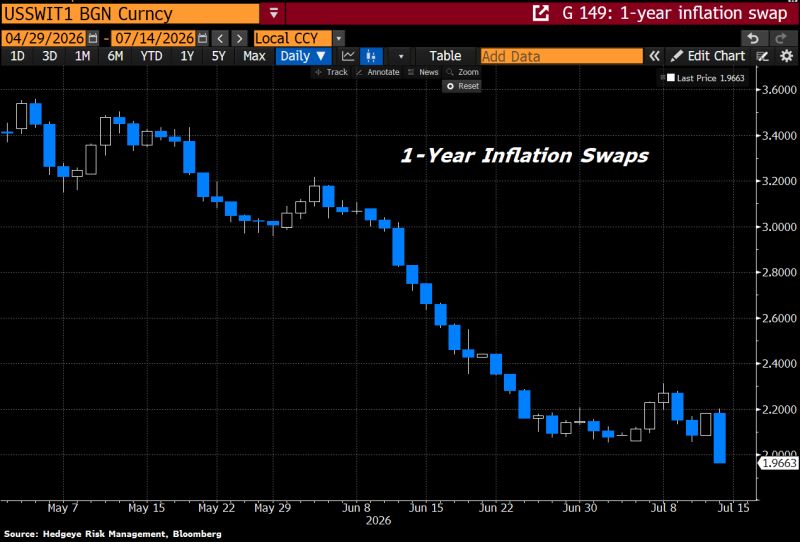
One-year inflation swaps fall below 2% for the first time since 2024 !!!
Source: Hedgeye
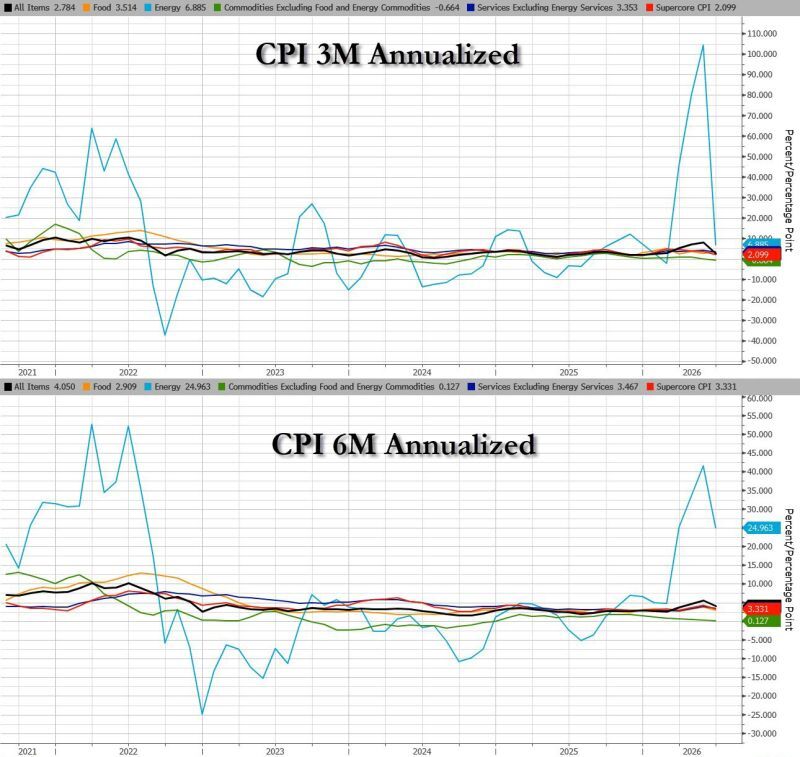
3M annualized US Headline CPI drops from 8.2% to 2.8%.
Source: zerohedge