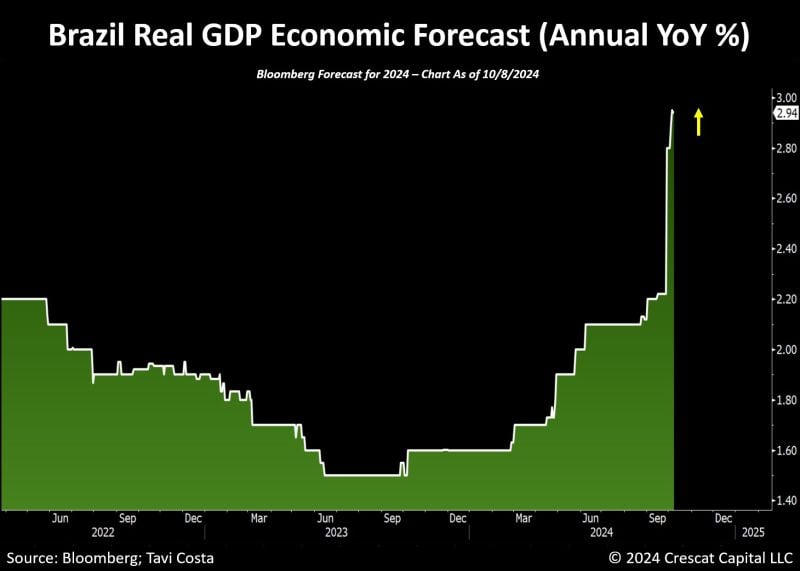
Meanwhile: Very significant upward revision in the real GDP forecast for Brazil this last month.
Source: Tavi Costa, Bloomberg
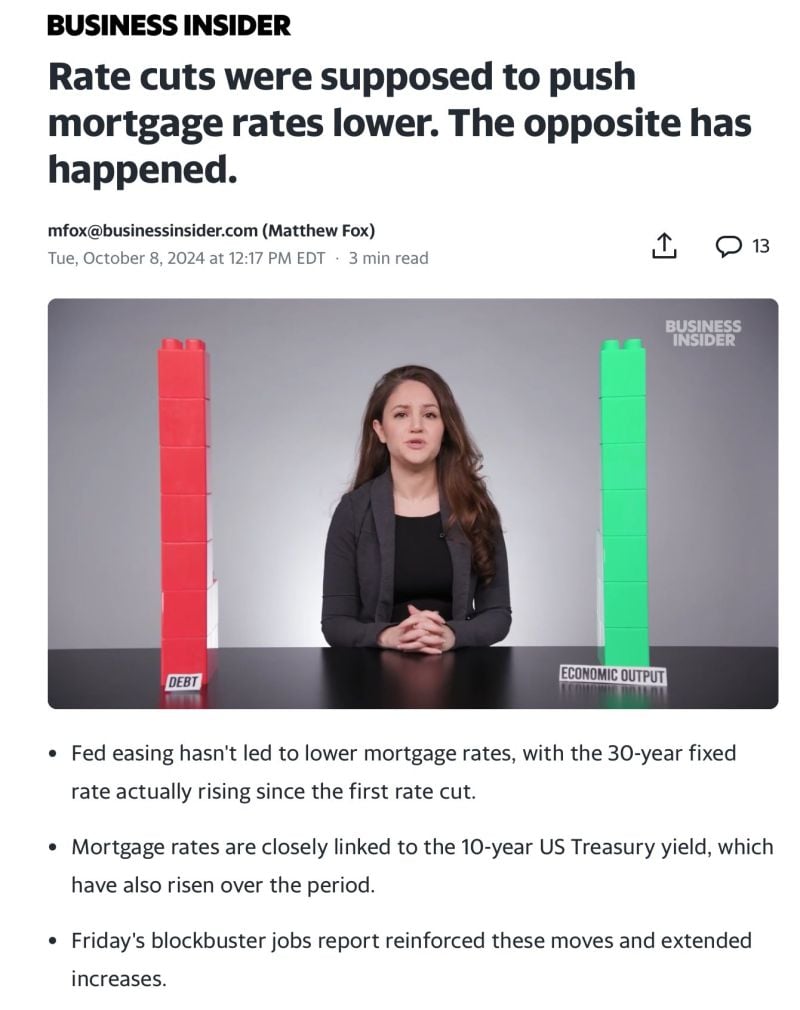
One of the reasons mentioned by many analysts to explain the aggressive rate cut (50bps) by the Fed in September was the following:macr
Shelter is the sticky component of inflation. If the Fed cut rates, we should see a drop in the mortgage rate which will enable more real estate supply and thus lower shelter inflation. Well, the Fed cut rates but mortgage rates are not declining. They are even moving higher? Has the Fed lost control of the bond market?
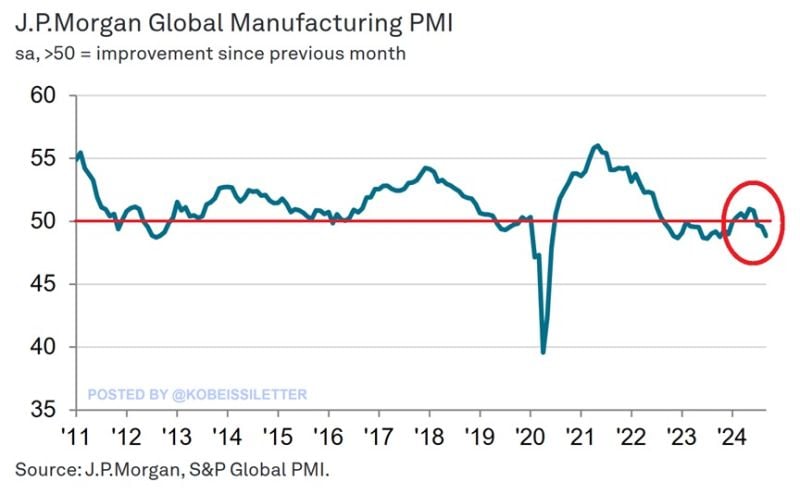
Global manufacturing is contracting:
The Global Manufacturing PMI index fell to 48.8 points in September, down from 49.6 in August, marking the 3rd straight monthly contraction. 4 of the 5 index components shrunk last month including output, new orders, employment, and stocks of purchases. Furthermore, new export orders declined at the fastest rate in 11 months. This implies that global trade volumes could be decreasing now by 3-4% year-over-year. Meanwhile, manufacturers' business optimism fell to a 22-month low, suggesting a grim outlook for the next few months. Source: JP Morgan, The Kobeissi Letter
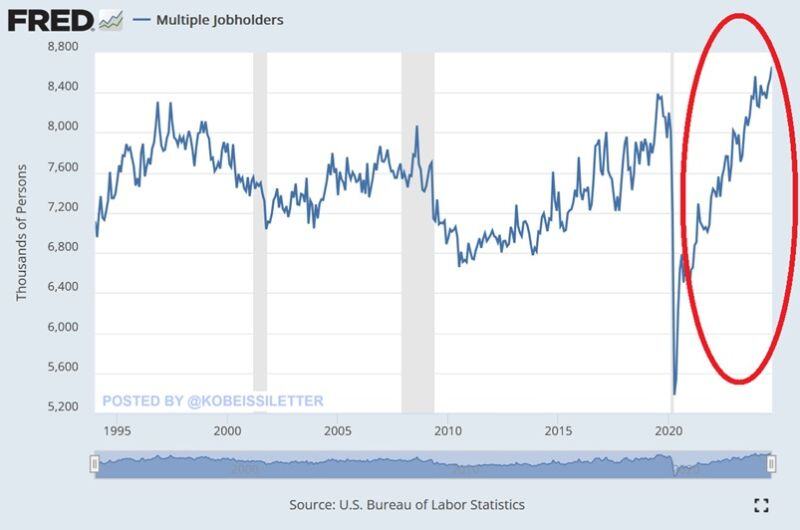
BREAKING: The number of people working MULTIPLE jobs in the US hit 8.66 million in September, a new record.
This is ~300,000 above the peak seen before the pandemic and ~600,000 above the 2008 peak. Furthermore, the number of part-time jobs has jumped by ~3 million over the last 3 years to a near-record 28.2 million. Concerningly, full-time employment has declined by 1 million since November 2023. Multiple jobholders have been rapidly rising over the last few years as Americans are fighting record-high prices. Millions of Americans are working multiple jobs to afford basic necessities. Source: The Kobeissi Letter
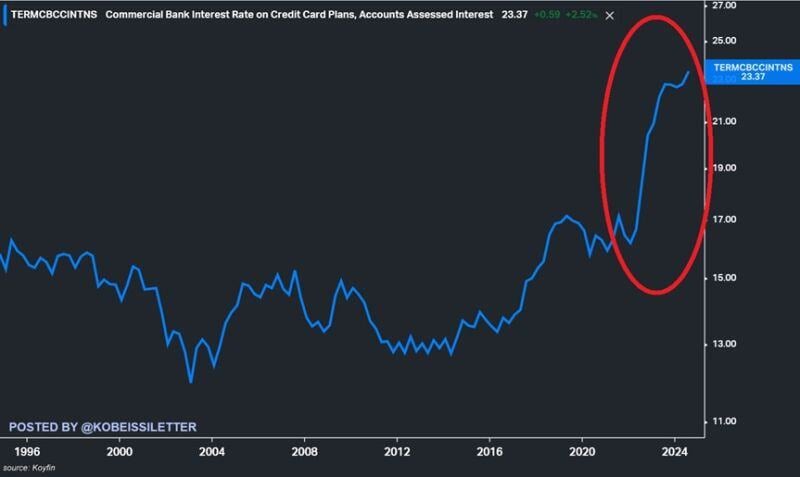
US credit card interest rates hit 23.4% in August, a new record.
Over the last 2 years, rates have soared by 7 percentage points. US consumers now have a record $1.36 trillion in credit card debt and other revolving credit meaning they pay a massive $318 billion annual interest. To put this into perspective, Americans paid just half of that in 2019 at ~$160 billion. Meanwhile, credit card serious delinquency rates are at 7%, the highest level since 2011. Source: The Kobeissi Letter
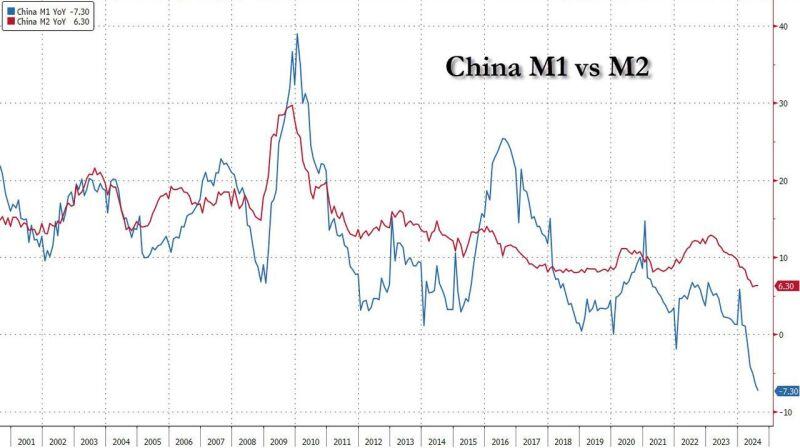
Goldman: to escape deflation and for the rally to be sustainable, China's M1 has to overtake its M2.
For that to happen, China will need to unleash a historic credit impulse (record new debt creation, launch QE) and global inflationary shockwave. Source: zerohedge
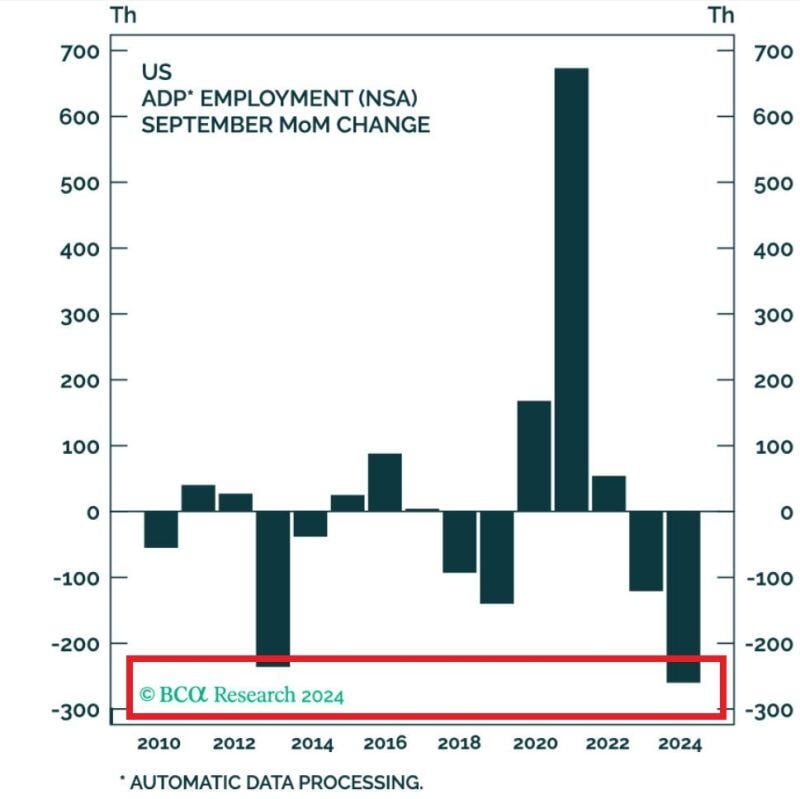
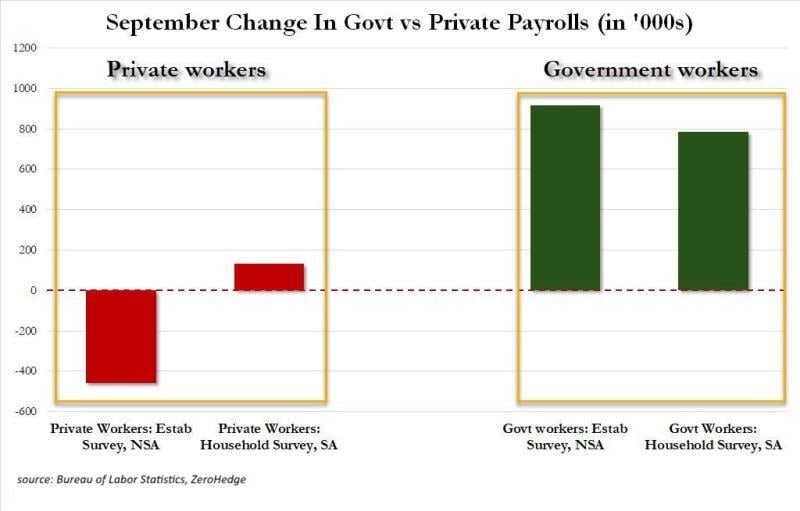
‼️IN REALITY US JOB MARKET SHED 458,000 PRIVATE JOBS IN SEPTEMBER‼️
Not seasonally adjusted private sector workers FELL by 458,000 in Sep. Government jobs SPIKED 918,000 This largely came as young people left summer jobs and returned to school while teachers went back to work. Source: Global Markets Investor
US job market is cooling down...
US Private businesses added 143,000 workers to their payrolls in September. Adjustment was almost 2x prior Septembers elevating the print,!!! On a non-seasonally adjusted basis payrolls FELL 260,000, the worst September in history. Source: Global Markets Investor