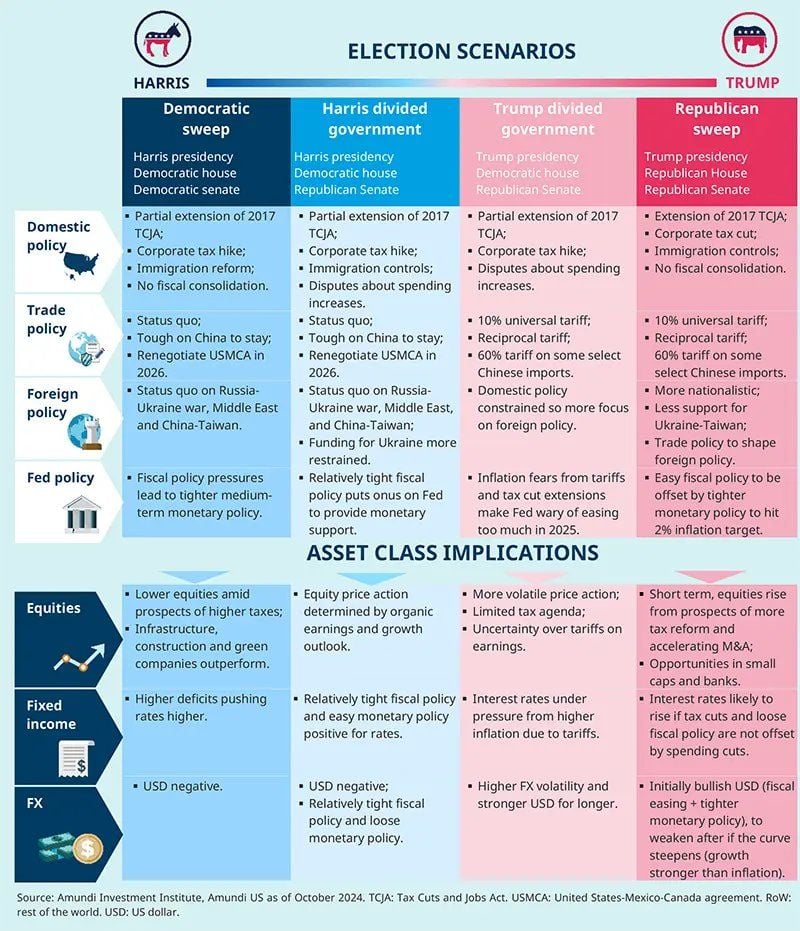
"cheat sheet" US elections
By Amundi
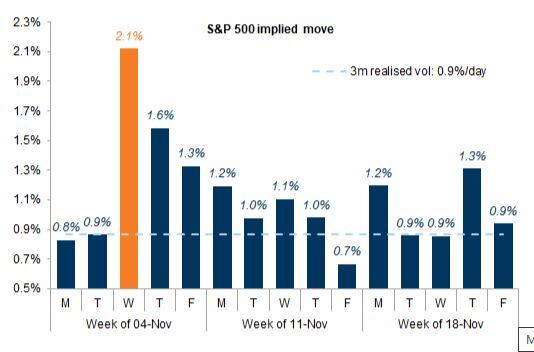
Markets are pricing a large move on Nov. 6th
Source: Mike Zaccardi, CFA, CMT 🍖@MikeZaccardi
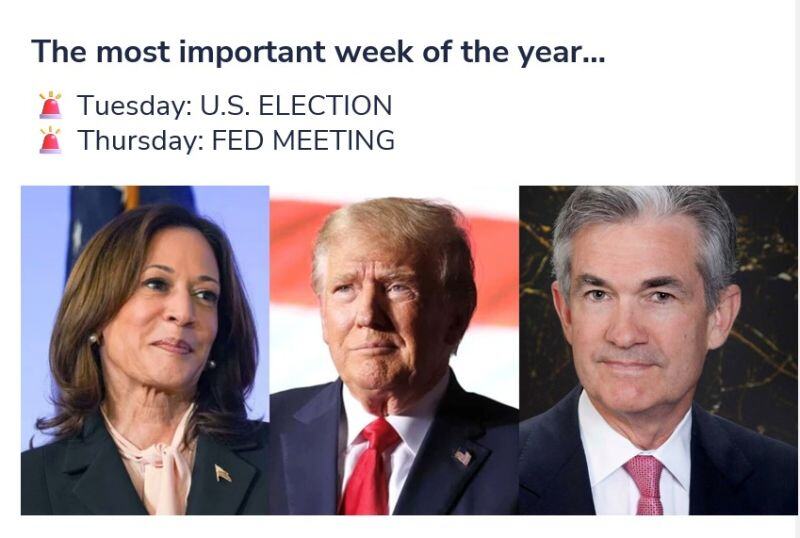
📢THE MOST IMPORTANT WEEK OF THE YEAR...
👉 In the US U.S. Presidential Election – Tuesday ISM Services PMI – Tuesday Initial Jobless Claims – Thursday Fed Rate Decision – Thursday U.S. Consumer Sentiment - Friday 👉 In the rest of the world BoE on Thursday In China, the NPC Standing Committee meeting will be closely watched for stimulus signals. 👉Earnings Notable earnings reports include Berkshire Hathaway (was Saturday), Palantir, Qualcomm and Novo Nordisk.
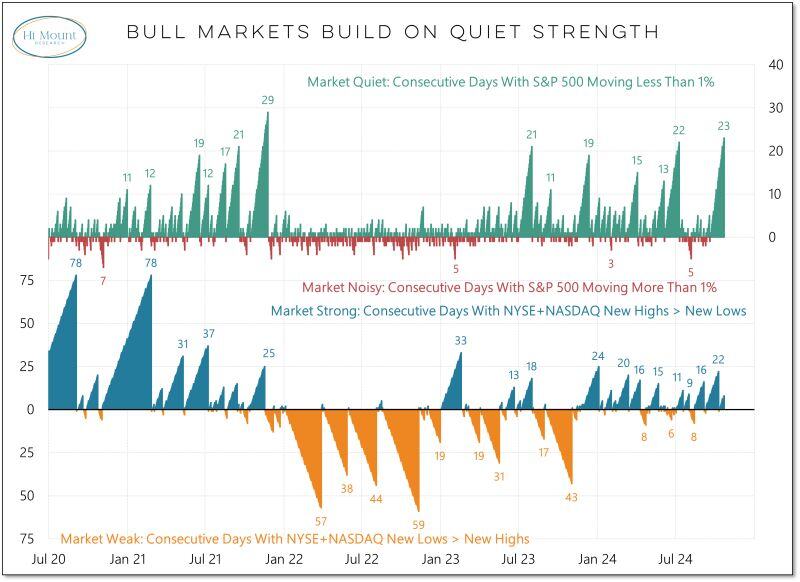
Still no dip to buy...
The S&P 500 is in its longest stretch without a 1% daily move over the past 2.5 years. Quiet markets tend to be strong markets and strong markets tend to be quiet markets. Source: Willie Delwiche, CMT, CFA @WillieDelwiche on X
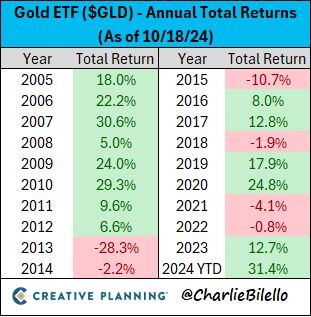
If the year ended today, it would be the best year ever for the Gold ETF which is up over 31% in 2024. $GLD
Source: Charlie Bilello
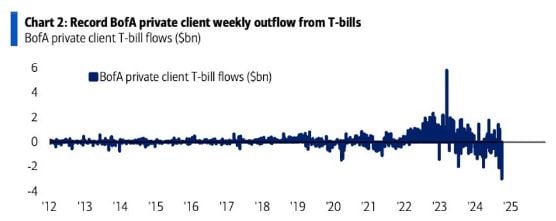
Investors sold the most amount of Treasury Bills in history this week
Source: Bank of America
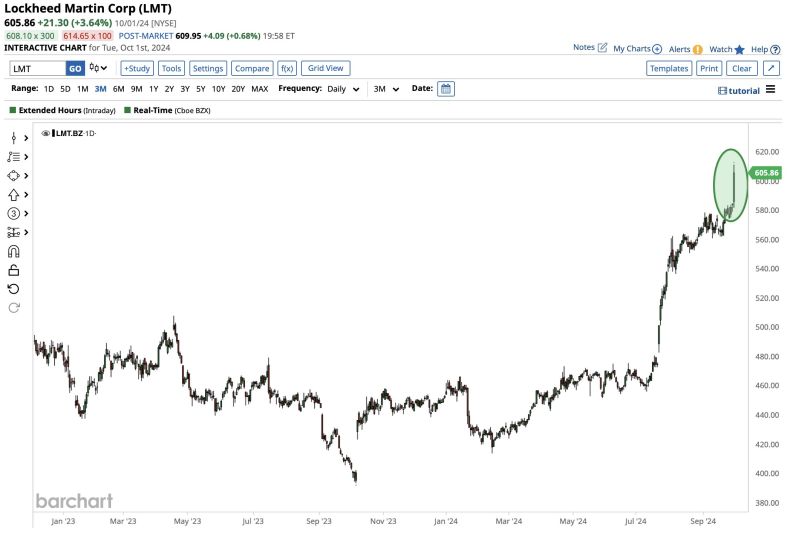
geopolitical risks are not going away anytime soon...
Lockheed Martin $LMT soars to all-time high 📈 Source: Barchart
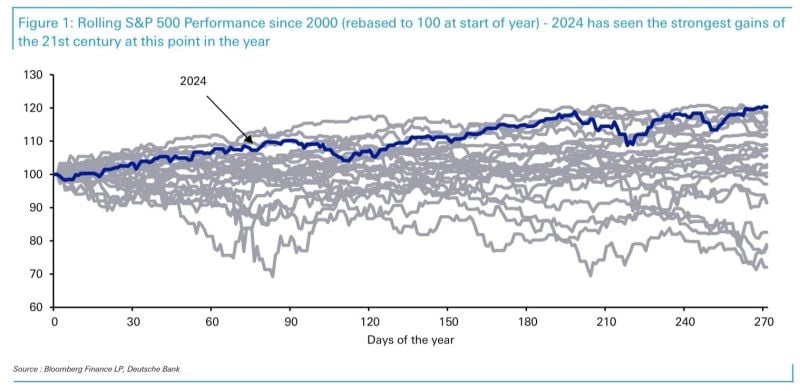
Deutsche: S&P 500 has seen its biggest YTD advance of the 21st century so far after 271 days of the year.
Equity markets continue to be carried on by a "magic combo": resilient earnings, a weak dollar, weak oil prices, lower bond yields, favorable macro background (growth surprising on the upside / inflation surprising on the downside), a dovish central bank pivot, and now fresh stimulus out of China. This helps the market "climbing the wall of worry", i.e US elections uncertainty,, Middle East tensions, yen carrytrade unwinding, etc. October is historically a volatile month. Let see if the sp500 can continue to rise in a straight line. Source chart: DB