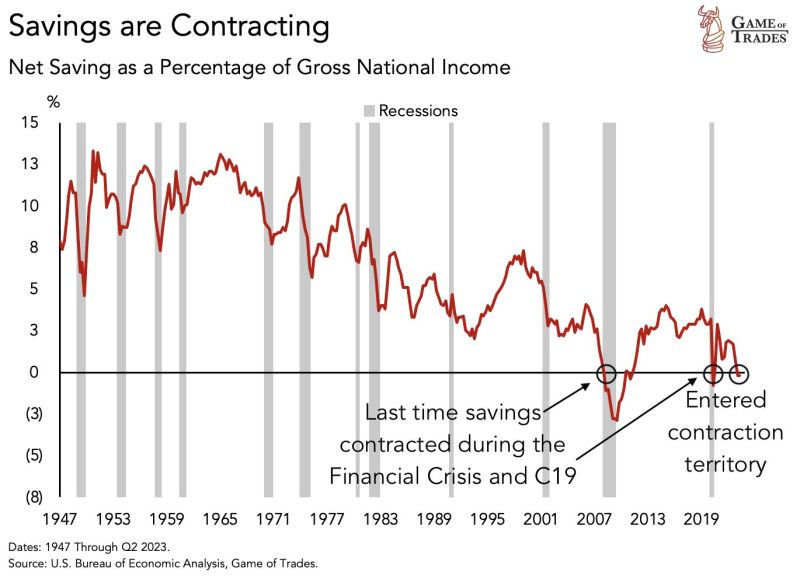
This has happened ONLY 2 times in the last 75 years. In the US, savings as a % of income is now contracting, indicating that people are find it VERY hard to save
The last 2 contractions happened in: - 2008 - 2020 High interest rate + high debt is a MAJOR problem for people Source: Game of Trades
Moody’s cuts U.S. credit outlook from stable to negative. Will markets just shrug it off on Monday?
Source: Trend Spider

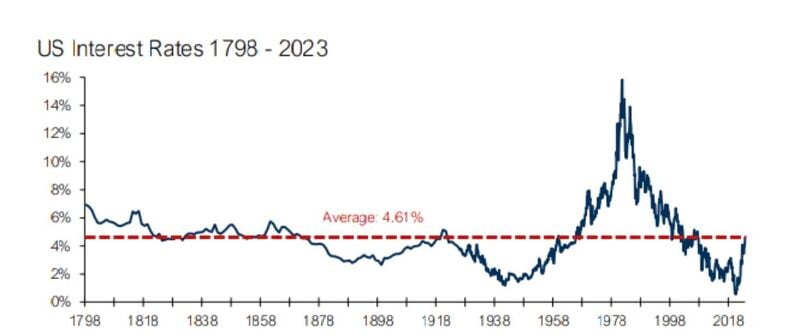
200+ years of US interest rates…
The Long View @HayekAndKeynes
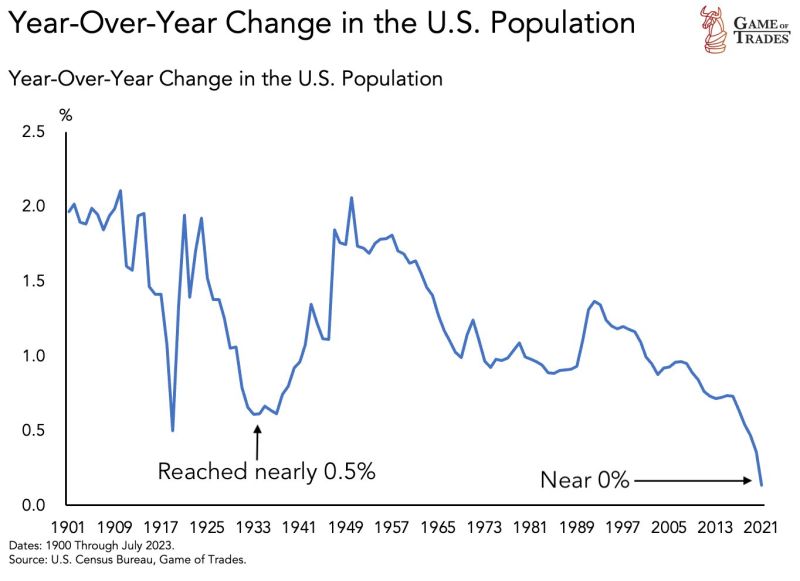
Demographics is becoming a serious issue for US growth
As shown on the chart below, US population growth has collapsed, reaching levels near 0% indicating almost NO growth. This is actually the worst population growth setup seen in over 100 years of US history. Current levels have NEVER been seen in 100+ years. Even during the Great Depression, population growth bottomed out at around 0.5% Source: Game of trades
One year before US elections...
President Biden’s approval rating is the lowest out of every president one year out from the election since Jimmy Carter. The news comes as a new swing state poll from The New York Times shows Donald Trump defeating Biden in a 2024 matchup. According to the poll, if the election were held today, Trump would beat Biden in Nevada, Georgia, Arizona, Michigan and Pennsylvania. Biden’s approval rating is sitting at 37% one year out from the election. Trump and Obama were at 43% at this same point in their presidency while Jimmy Carter was at 32%. Source: Collin Rugg

Key Events This Week:
1. Fed Chair Powell Speaks - Wednesday 2. Initial Jobless Claims - Thursday 3. Fed Chair Powell Speaks - Thursday 4. Consumer Sentiment data - Friday 5. ~10% of S&P 500 reports earnings this week 6. Total of 12 Fed speaker events All attention remains on the Fed. Source: The Kobeissi Letter

Central Banks around the world are now cutting rates at the fastest pace in more than 3 years
When will the U.S. follow suit? Source: Barchart, BofA

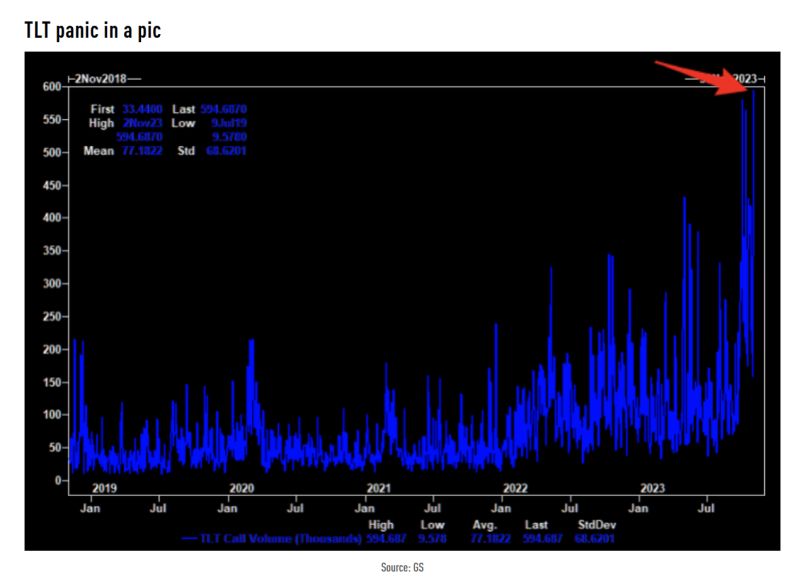
The crowd is piling into TLT (iShares US Treasuries 20y+ ETF) calls
Friday was the largest TLT call volume ever. Source: TME, GS