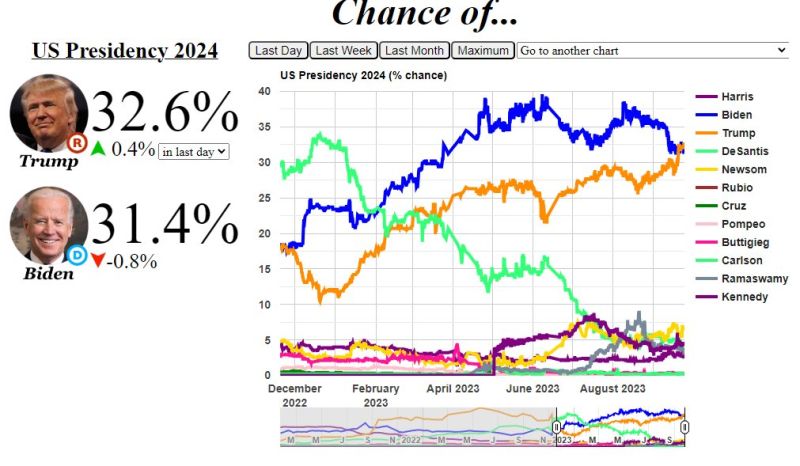
First time in 2023 that ElectionBettingOdds has had Trump in the lead
Source: Bespoke
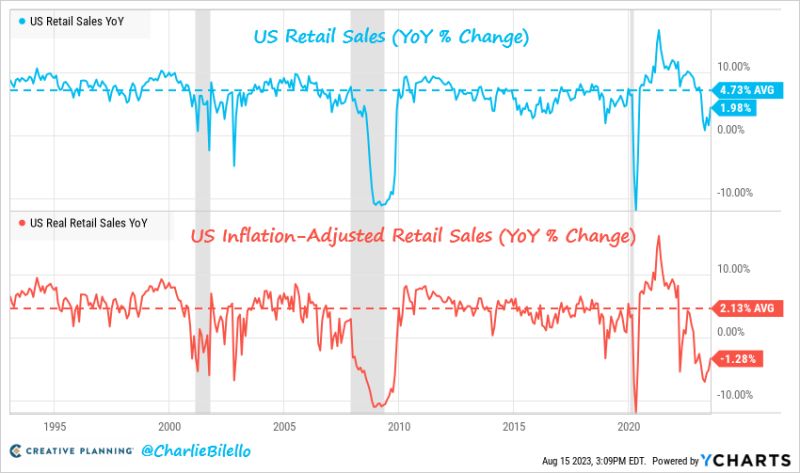
After adjusting for inflation, US retail sales fell 1.3% over the last year, the 9th consecutive YoY decline
That's the longest down streak since 2009. Nominal retail sales increased 2% YoY vs. a historical average of 4.7%. Source: Charlie Bilello
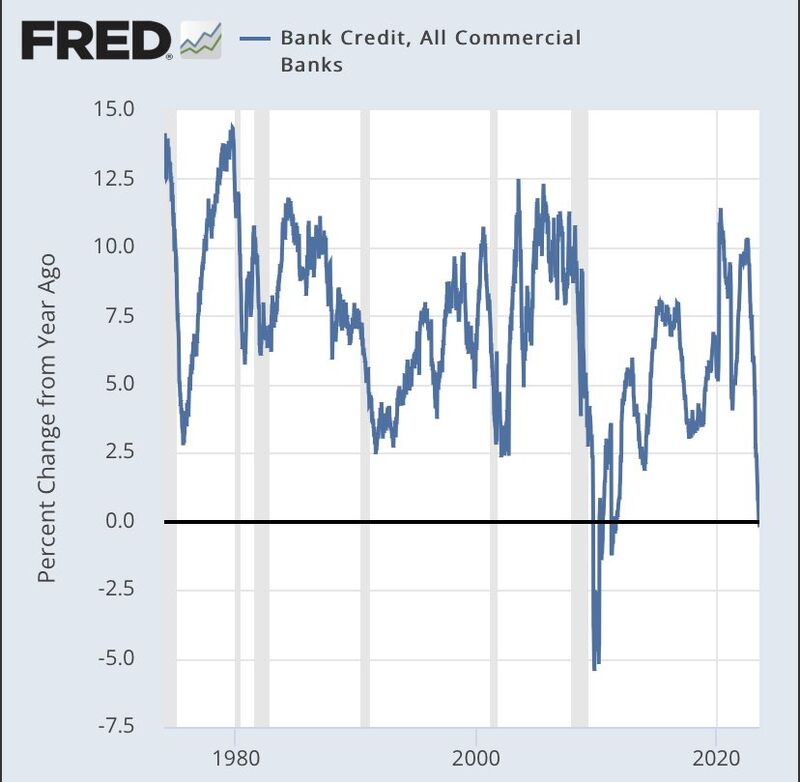
US Bank credit YoY is now -0.2% YoY. First time negative since 08 (Keep in mind that in the US about 25% of credit is securities and the other 75% loans)
Source: FRED, Adem Tumerkan
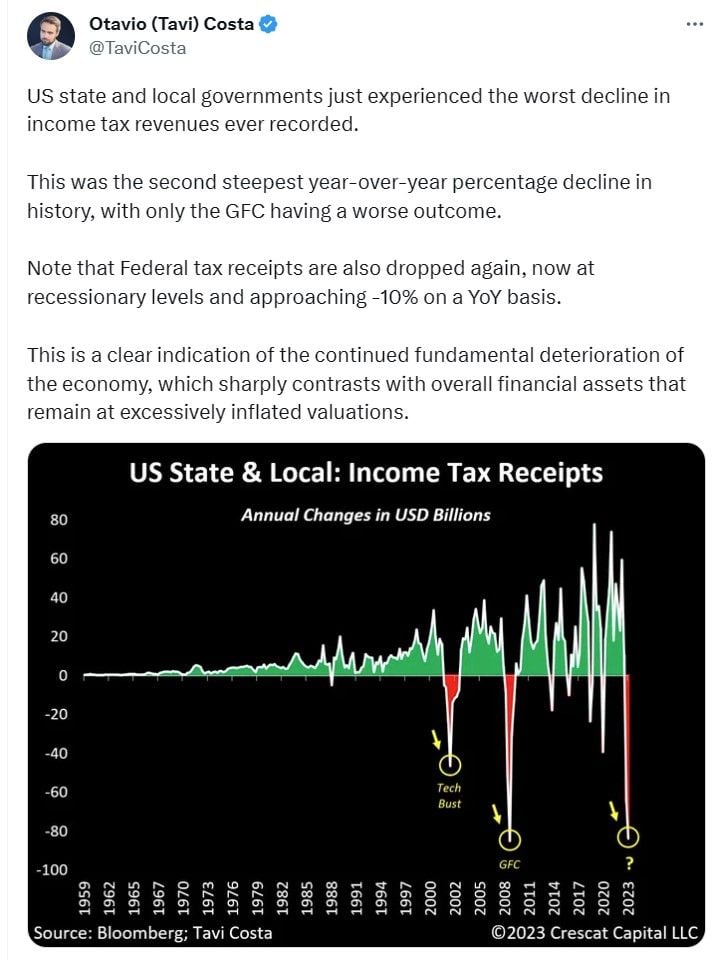
Despite the strong upward move of the Citigroup US economic Surprises index and the strong YTD performance of financial assets, there are signs that things are that rosy for the SU economy
Source: TaviCosta
US credit delinquencies including housing have now risen above 2009 levels.
Source: Sven Henrich
Nokia sold 437 million phones in 2007. And Apple sold 1.4 million iPhones. Apple will sell more than 220 million iPhones this year
Nokia sold 437 million phones in 2007. And Apple sold 1.4 million iPhones. Apple will sell more than 220 million iPhones this year. And Nokia no longer makes its own phones. Source: John Erlichman

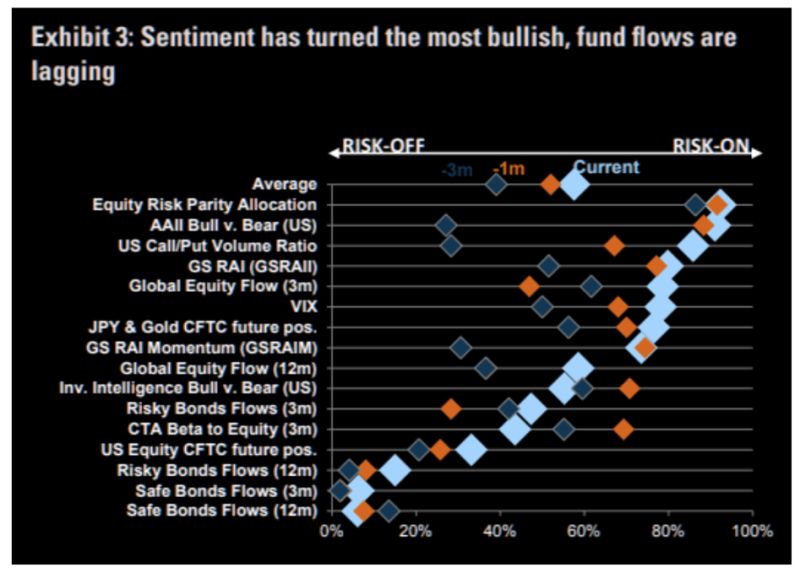
Bullish sentiment on equities is getting even more bullish
Bullish sentiment on equities is getting even more bullish. Source: TME, Goldman Sachs
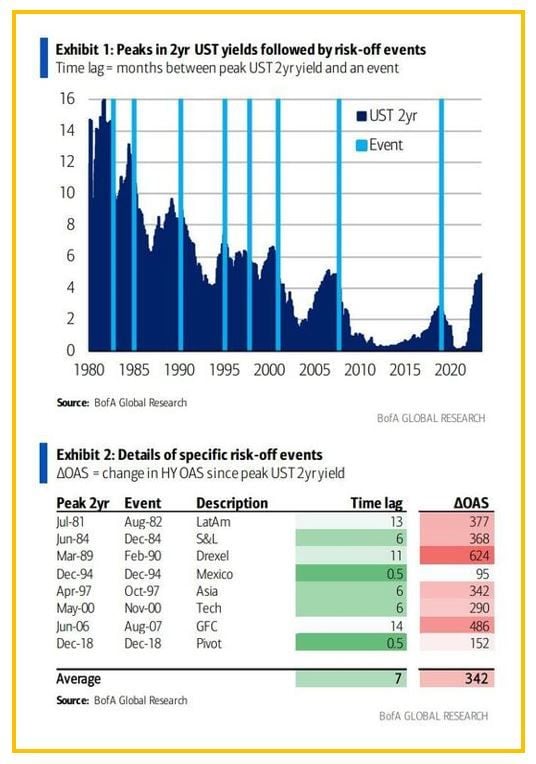
These charts by Bank of America show that every single episode of a local peak in UST 2yr yield was followed by some risk-negative event over the past 40 years.
These #charts by Bank of America show that every single episode of a local peak in UST 2yr yield was followed by some risk-negative event over the past 40 years. Such episodes ranged from mild (Mexican peso crisis in Dec 1995; HY +95bp) to moderate (Asia FX crisis in Oct 1997; HY +350bp ) to severe (GFC; HY all-time wides). The lag between the peak in 2yr yield and subsequent event varies from just a couple of weeks to just over a year, with an average being 7 months. Source: BofA, www.zerohedge.com