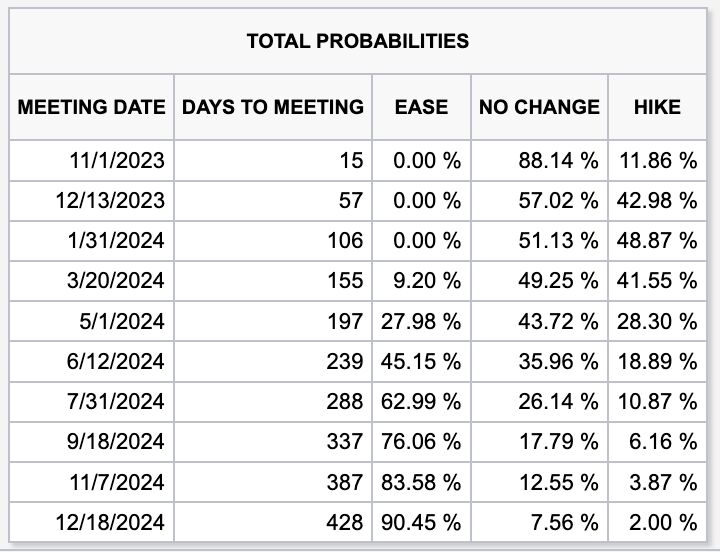
18 Oct 2023
Stunning to see that markets are beginning to price-in chances of rate HIKES all the way until December 2024
There's now a ~49% chance of a rate hike by January 2024. There is even an 11% chance of a rate hike in July 2024... Meanwhile, the 10-year note yield is nearing 4.90% right now. Will 8% mortgages soon going to look like a good deal? Source: The Kobeissi Letter
17 Oct 2023
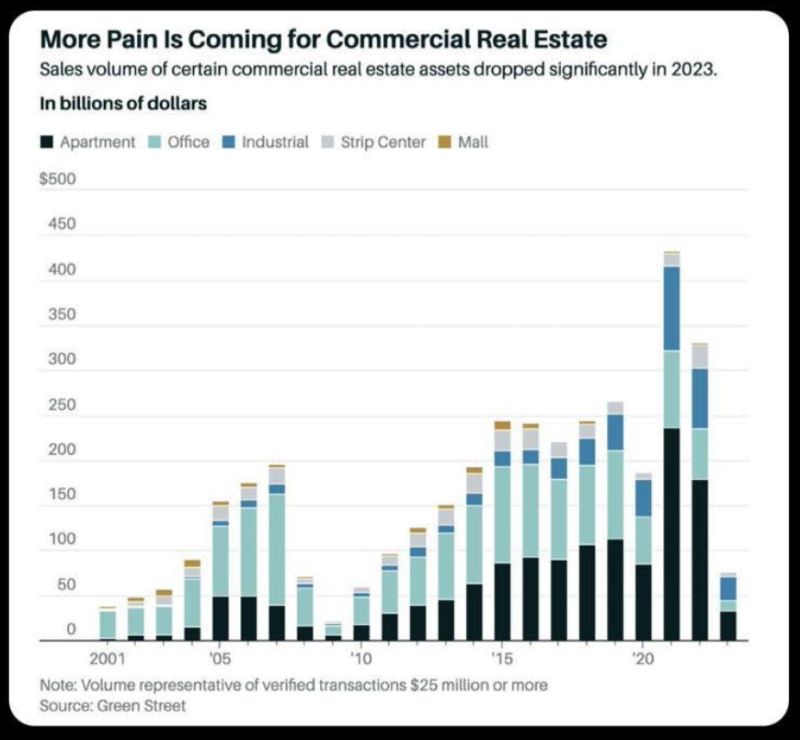
US Commercial real estate sales volume have fallen to the lowest level in 13 years
Source: Green Street
16 Oct 2023
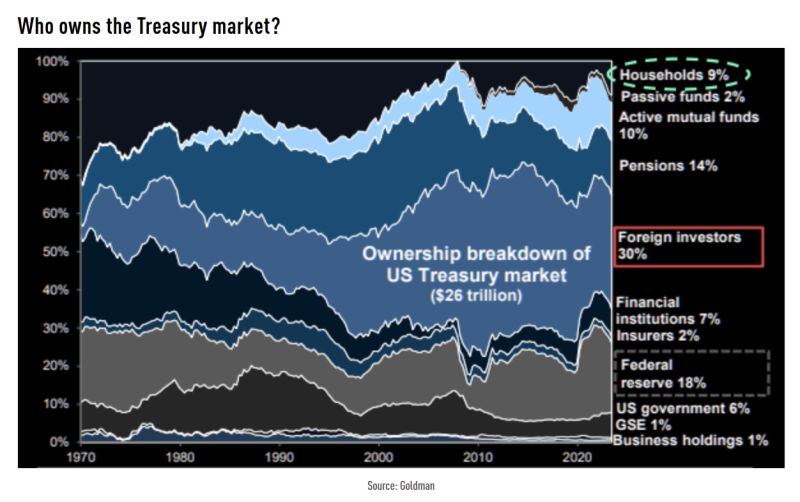
Ownership breakdown of the US Treasury market ($26 trillion)
Source: Goldman Sachs, TME
16 Oct 2023
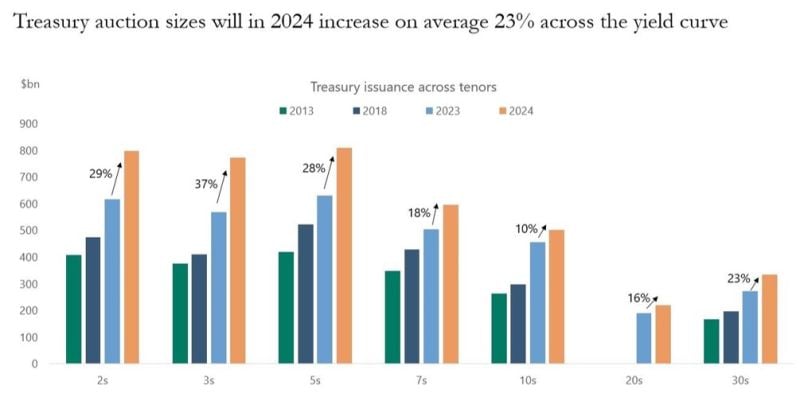
Heavy Supply remains a risk for US Treasuries
How long will the Fed be able to continue with QT? Source: Michel A.Arouet
16 Oct 2023
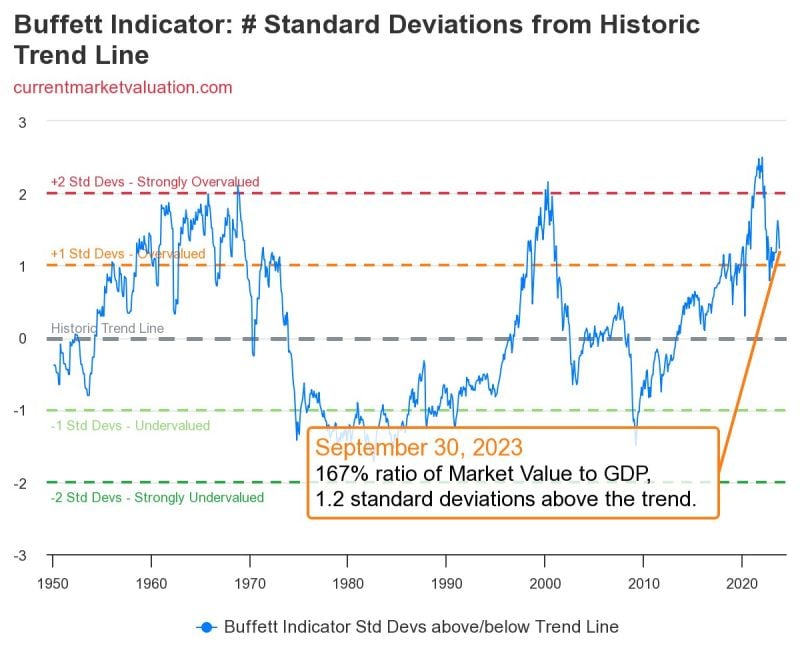
Where we are on the Buffett indicator
(The ratio of the total United States stock market value to GDP) Source: Brian Feroldi
16 Oct 2023
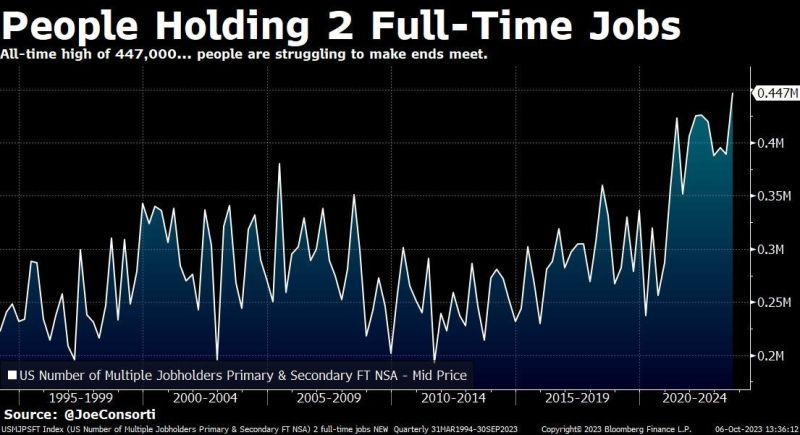
BREAKING: A record 447,000 Americans are now working 2 full-time jobs, per Joe Consorti
Source: Barchart, Bloomberg
13 Oct 2023
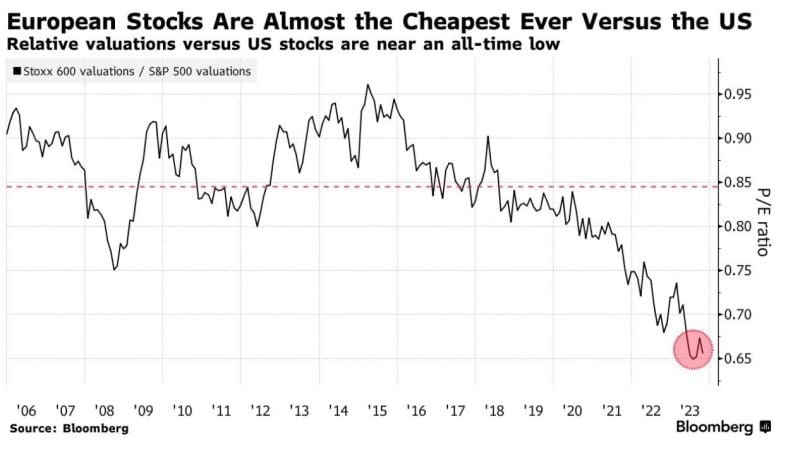
There are good reasons why European stocks are so cheap compared with US stocks
Overregulation, lack of innovation, to name a few Source: Michel A.Arouet, Bloomberg
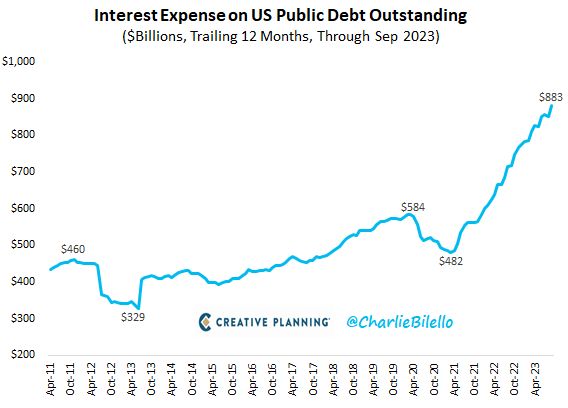
13 Oct 2023
The Interest Expense on US Public Debt rose to $883 billion over the past year, another record high
If it continues to increase at the current pace it will soon be the largest line item in the Federal budget, surpassing Social Security. Source: Charlie Bilello