
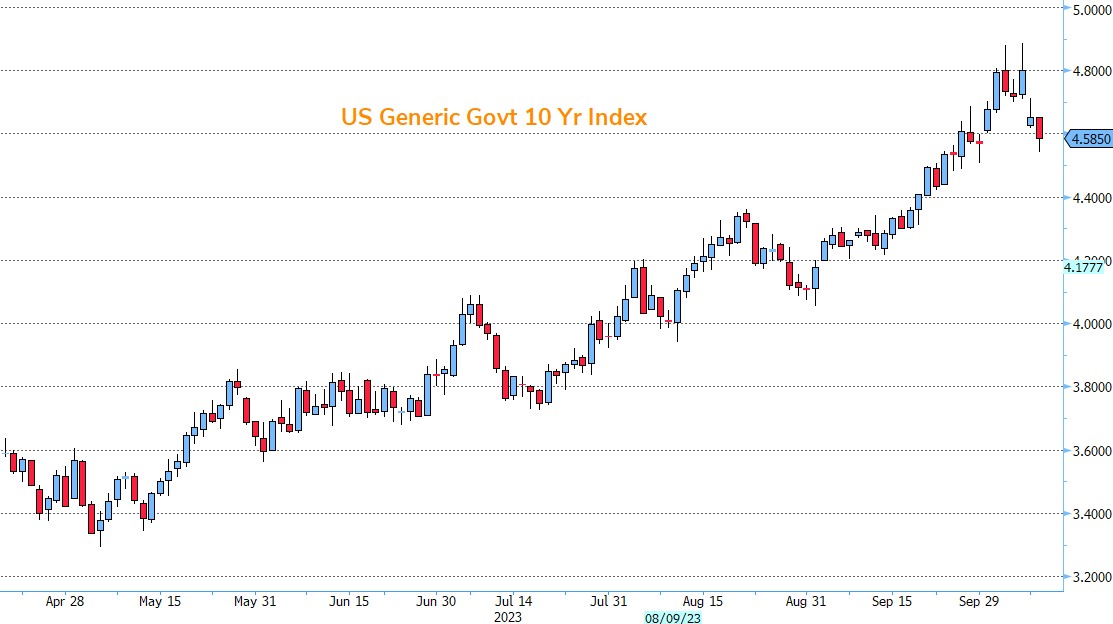
US 10-year Yield pullback from last week peak
US 10-year Yield pullback sharply from last week peak. After the Non-Farm Payrolls report on Friday, the US 10-year Govt Yield came close to hitting 4.9%. As of today, that Yield is down below 4.6%.
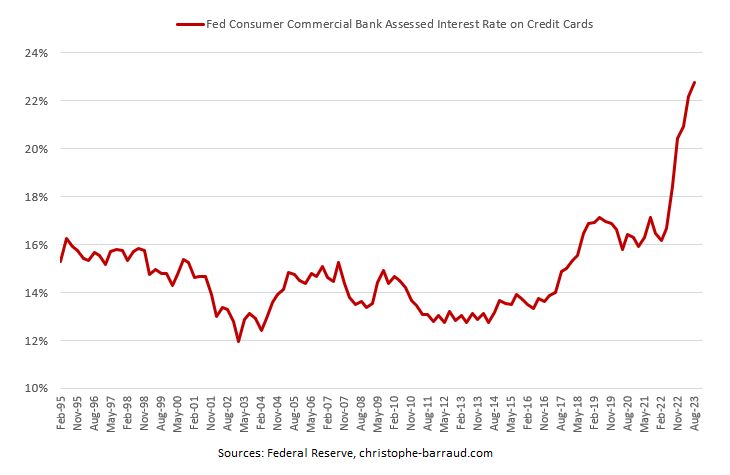
US average interest rate on credit cards is now close to 23% ⚠ (hitting a new record high since data are recorded)
Source: C.Barraud
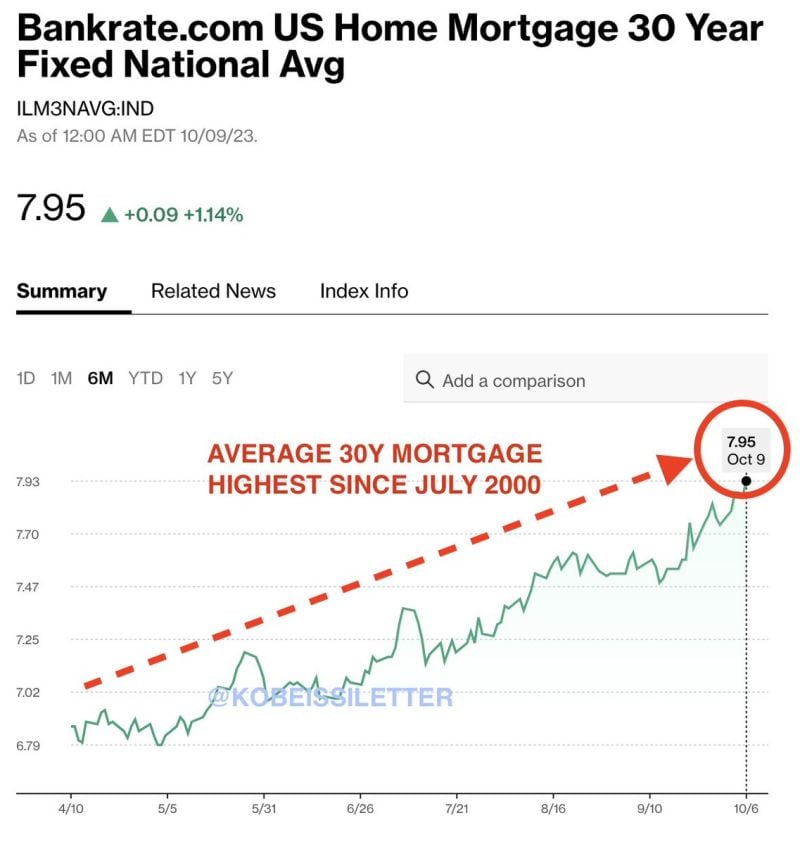
Average interest rate on a US 30-year mortgage rises to 7.95%, its highest since July 2000
Mortgage demand also just fell to its lowest level since 1995. 8% mortgages are the new normal. Source: The Kobeissi Letter
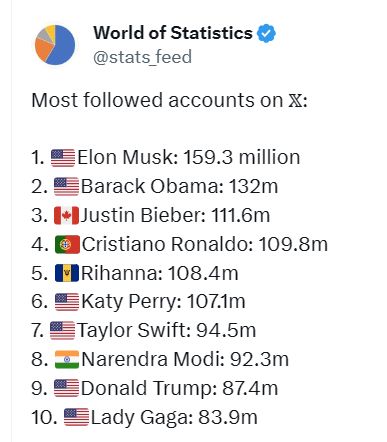
Stars on X
By: World of Statistics
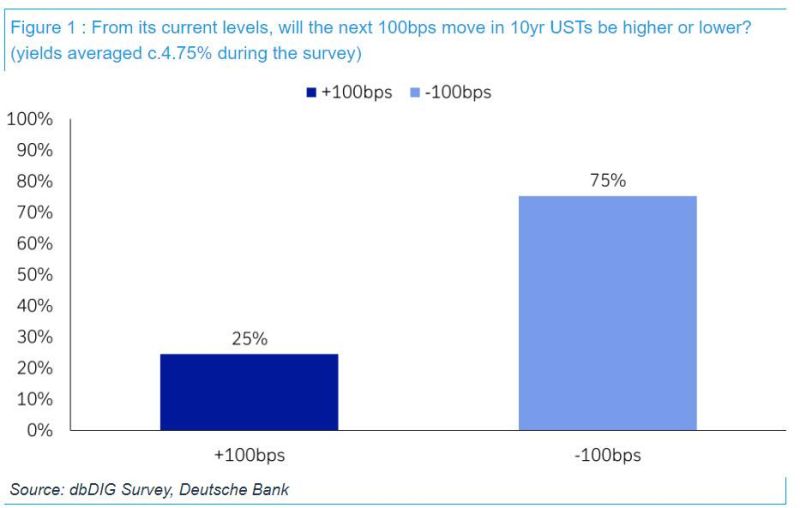
Vast majority on Wall Street think next 100bps move in 10Y yields is LOWER (and vast majority think the next 10% S&P 500 move will be LOWER)
The Deutsche Bank October 2023 global financial market survey, conducted between the 3rd and 6th of October, had 410 responses from around the world. - 75% think the next 100bps move in US 10yr yields is lower (average yield 4.75% during the survey). A big turnaround from June’s results where a small majority expected 4.5% before 2.5% when we were halfway between the two. Well done to that small majority as it got there in just 3 months. - 72% think the next 10% move in the S&P 500 will be lower. Slightly less than in June. In March 76% thought the next 10% move would be up so a different mood to earlier this year. Source: DB
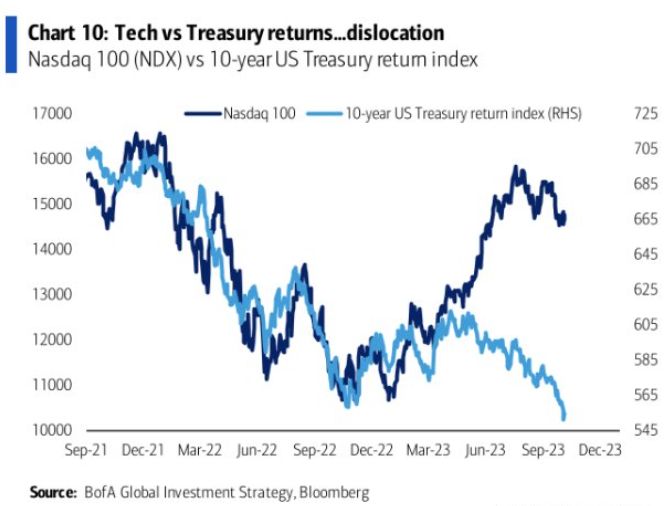
The gap between returns in tech stocks and US Treasuries has widened significantly since June
As bond prices continue to plummet but equities hold higher, this gap is getting larger. Source: BofA, The Kobeissi Letter
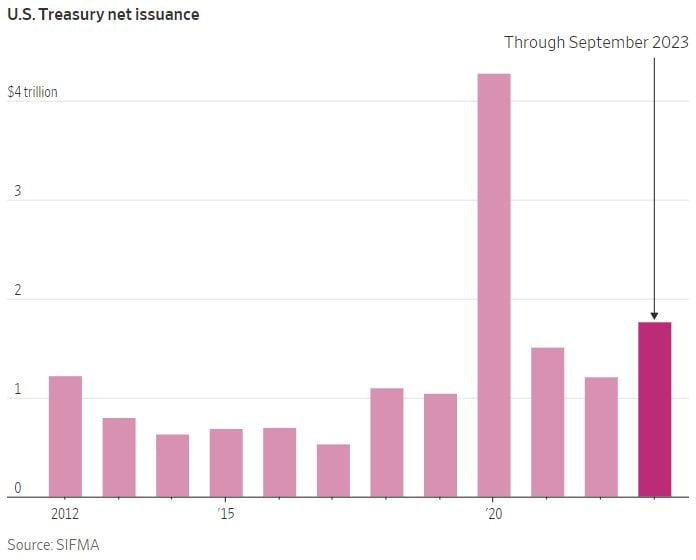
The US has already issued $1.76 trillion in net Treasury securities through September
It will be well over $2 trillion by year-end, trailing only 2020 for the largest net debt issuance of any year in history. Source: Charlie Bilello
A big short squeeze in the making?
GS data shows US CTA are now SHORT -$40B of SPX, the largest short in Goldman models history.
