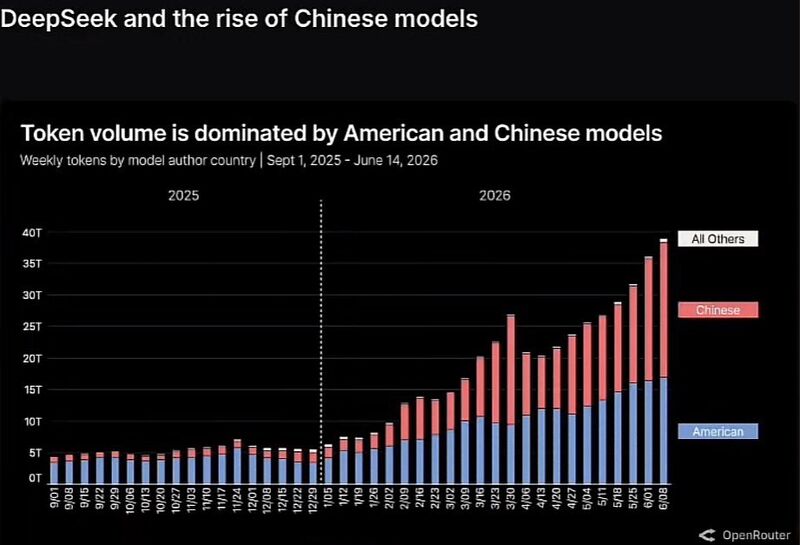
In 2025 American AI dominated with 90% market share.
Today Deep Seek and other AI open source Chinese AI has overtaken the US and now control about 52% of the market. Why? Because Chinese AI is much cheaper. Source: QE Infinity
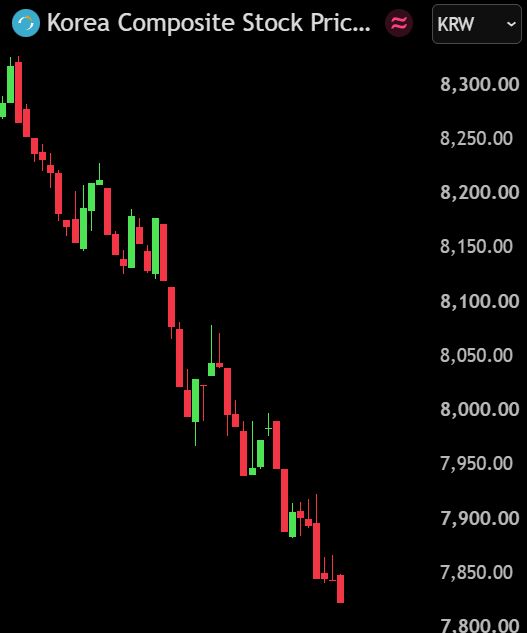
South Korea's KOSPI has crashed -6% from today's high as foreign investors continue to sell ahead of Samsung's earnings report.
Foreign investors sold ₩2,200,000,000,000 worth of Korean stocks today, marking their 11th consecutive day of net selling. Their cumulative net sales have now reached ₩157.3 trillion ($116 billion) since 2026. Samsung is set to release its Q2 earnings on July 7, with Q2 operating profit expected to surge 18x. Source: Bull Theory
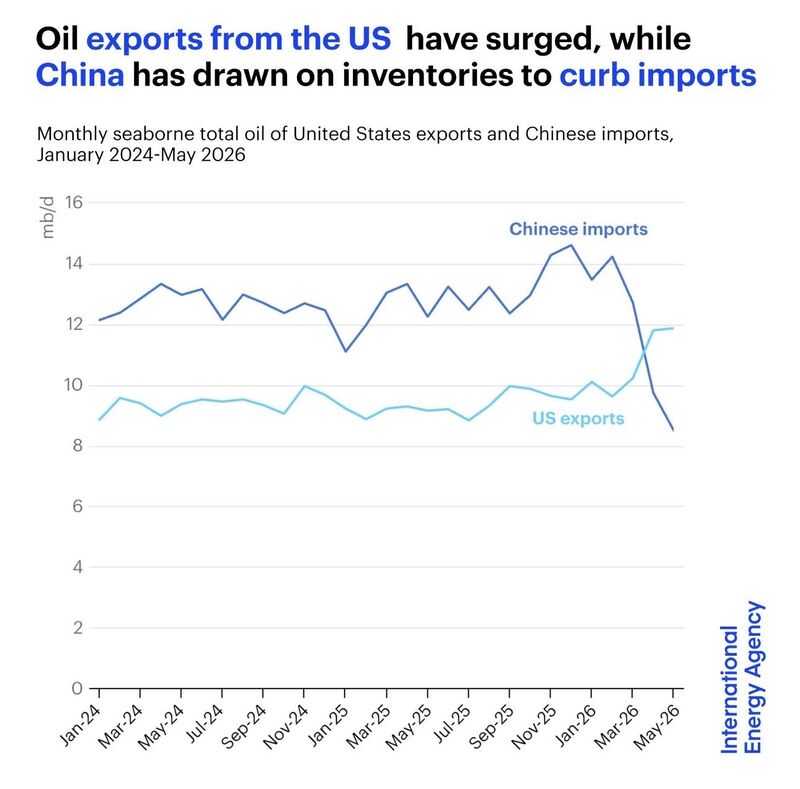
One chart may have just revealed a major shift in the global energy order.
For the first time in history, U.S. oil exports have surpassed China's crude oil imports. At first glance, it looks like just two lines crossing on a chart. In reality, it could mark a profound structural change. For two years, China's crude imports hovered around 12–14 million barrels per day. Then they suddenly plunged to roughly 8.5 million. At the same time, U.S. oil exports, long stuck around 9–10 million barrels per day, surged above 12 million. Why? China didn't stop buying oil because demand disappeared. It stopped because supply became constrained. • Nearly 38% of China's crude imports depended on the Strait of Hormuz. • Gulf producers faced major disruptions. • Russia was already exporting at full capacity. • U.S. light sweet crude isn't an ideal substitute for many Chinese refineries. With few alternatives, China began drawing down strategic inventories instead of importing. That collapse in imports isn't necessarily a sign of weaker demand. It may be evidence of a country relying on its emergency reserves to navigate one of the biggest supply shocks in years. Meanwhile, U.S. exporters stepped in to replace part of the missing Gulf supply. Sometimes, the most important geopolitical shifts don't make the front page. They simply appear when two lines cross on a chart. Source. Jack Prandelli on X, IEA
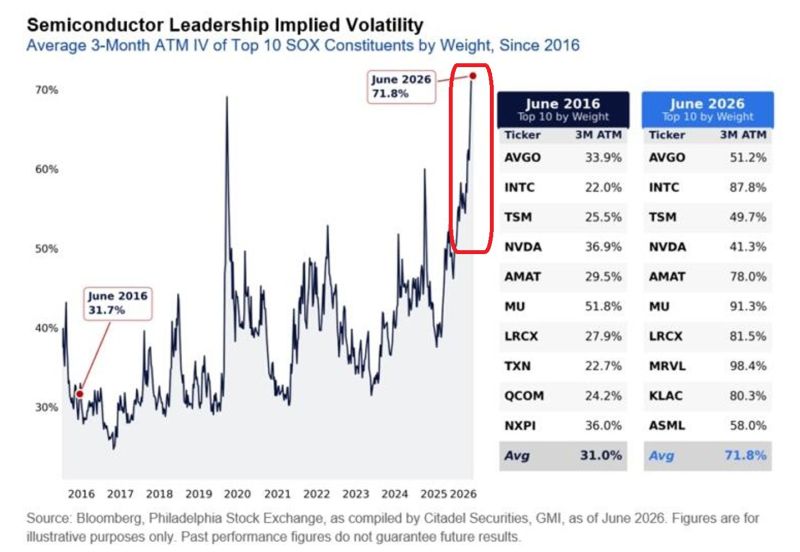
Semiconductor volatility is exploding.
The average 3-month implied volatility of the 10 largest U.S. semiconductor stocks has surged to 72%, its highest level in at least a decade—and more than double where it stood in 2016. The market is reacting fast: SOXX has fallen 14% in just a few sessions, while the leveraged SOXL ETF has plunged 40%. This is the sector that powered the AI bull market. History shows that when semiconductor volatility spikes to these extremes, markets start questioning the sustainability of the cycle. Is AI's biggest winner becoming its biggest risk? Source: Global Markets Investor, Citadel Securities
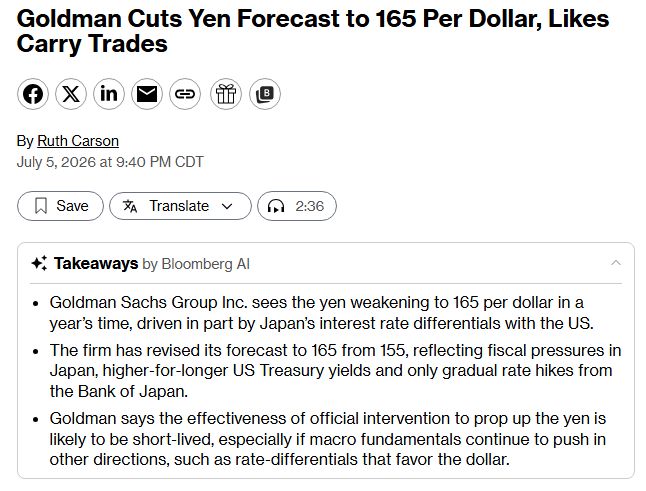
Japanese Yen will collapse to 165 against the U.S. Dollar, its weakest level since 1986, warns Goldman Sachs
Source: Barchart, Bloomberg
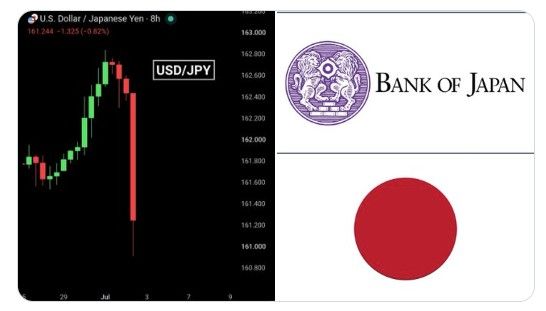
🚨 THE BANK OF JAPAN MAY HAVE STEPPED INTO THE FX MARKET AGAIN.
USD/JPY surged to a fresh 40-year high of 162.84 before plunging to 160.90 within hours. A 1.2% intraday reversal in one of the world's most liquid currency pairs is highly unusual. It mirrors what happened in April and May, when Japanese authorities spent roughly $72–73 billion selling U.S. dollars and buying yen to slow the currency's collapse. The pattern looks strikingly familiar: • New multi-decade high. • Sudden, aggressive reversal. • Speculation of official intervention. There has been no official confirmation yet. But the speed and magnitude of the move are exactly what markets expect when Tokyo steps in. Even after the sharp rebound, the yen remains close to its weakest level in four decades, keeping pressure on policymakers as imported inflation rises and global markets watch for their next move. Source: Bull Theory
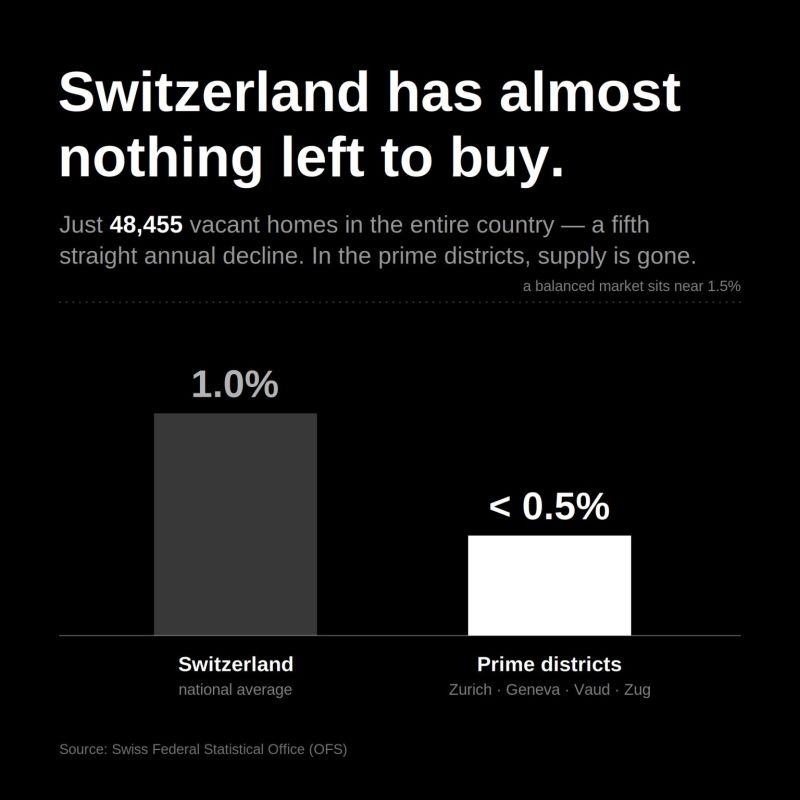
Switzerland isn't running out of buyers. It's running out of homes.
The national vacancy rate has fallen to just 1.0%, marking the fifth straight annual decline. In prime markets such as Zurich, Geneva, Vaud, and Zug, vacancy is below 0.5%. This isn't a typical property cycle. It's a structural shortage. Strict planning rules severely limit new construction, while population growth continues to fuel demand. Only 48,455 homes remain vacant across the entire country. For foreign buyers, the market is even more restricted. Under Lex Koller, many of Switzerland's most desirable residential areas remain largely off-limits to non-residents. The biggest constraint isn't affordability. It's access. In one of the world's tightest housing markets, owning the right to buy may be more valuable than the property itself. Source: Rémi Berthon Swisseon Swiss Federal Statistical Office / The Luxury Playbook
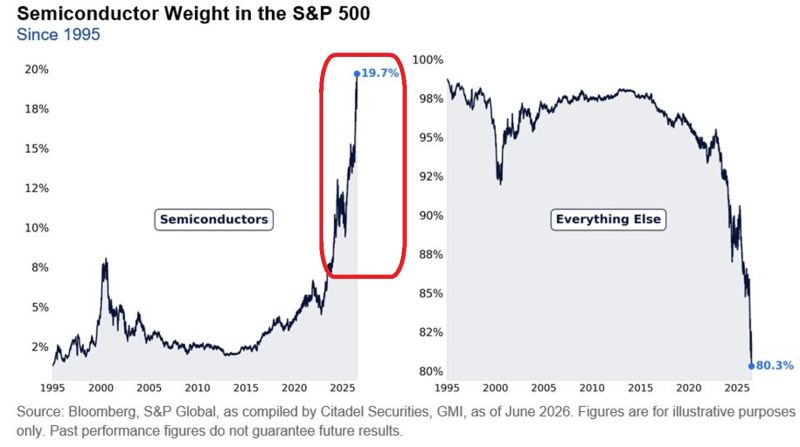
🚨US stock market concentration has never been this extreme:
Semiconductor stocks now reflect 19.7% of the S&P 500's total market cap, the most EVER. This figure has QUADRUPLED since June 2020. As a result, every other sector combined now accounts for just 80.3% of the index, the lowest share EVER. Meanwhile, the semiconductor index, $SOX, is trading now ~70% above its 200-day moving average, the widest divergence since the 2000 Dot-Com Bubble peak. How much further can this concentration stretch before something breaks? Source: Global Markets Investor