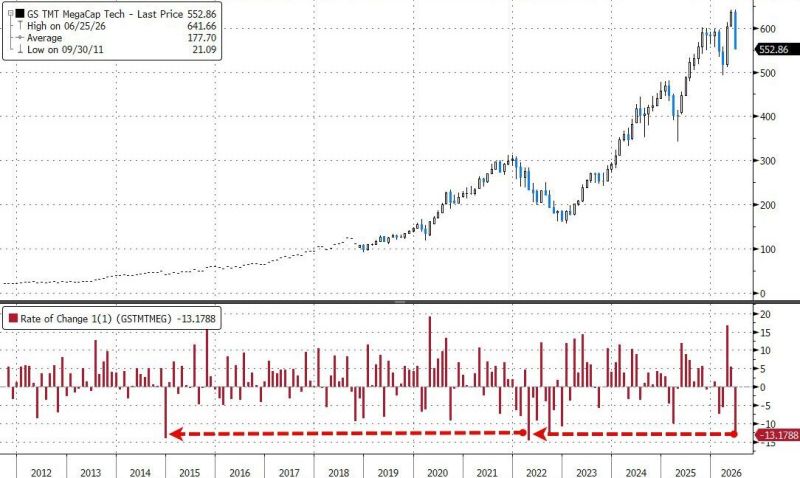
In case you missed it... US MegaCap Tech is facing its worst month since April 2022
(and 3rd worst month ever)... Source: zerohedge
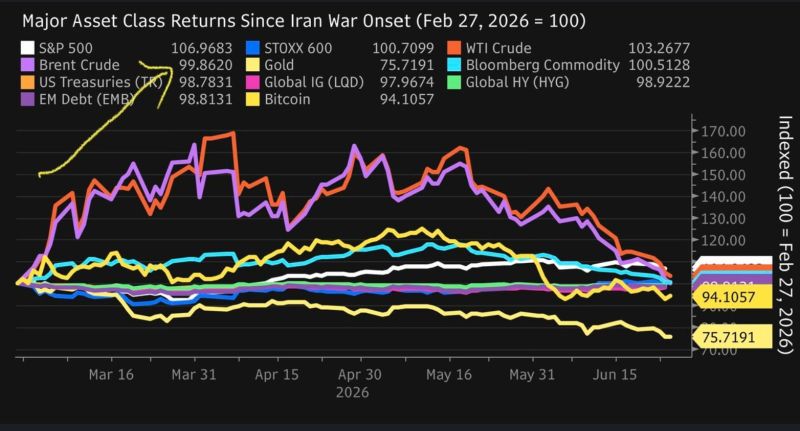
Brent crude is now trading below where it was before the Iran conflict began.
Think about that. The market has effectively priced in a clean resolution to one of the largest geopolitical energy shocks in recent history. That's a powerful reminder that markets don't wait for certainty. They price the most likely outcome. But while the geopolitical risk premium may have disappeared from prices, that doesn't necessarily mean the underlying risk has... Stay tuned Source: Blackrock, UBS
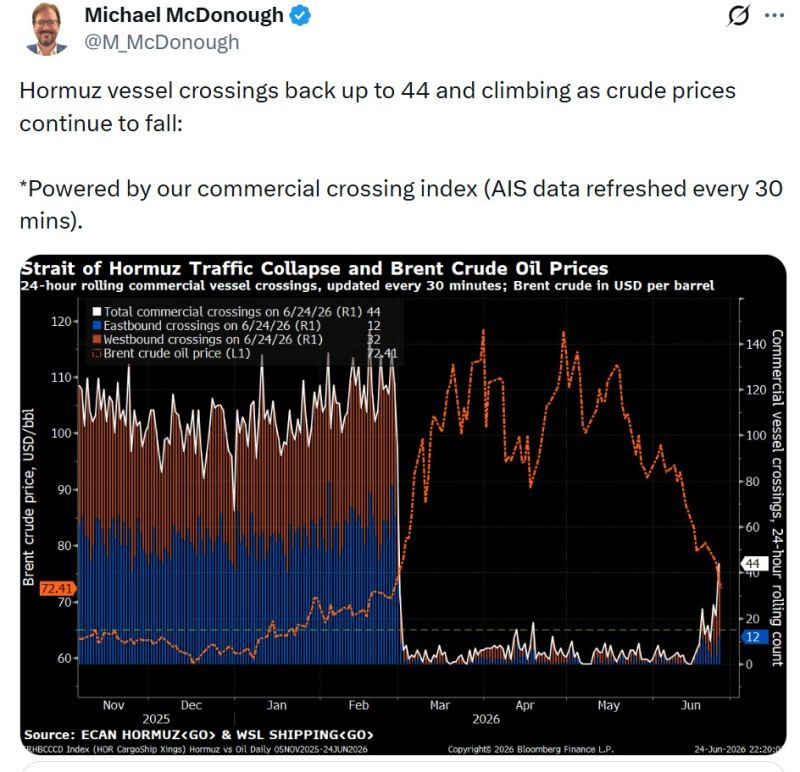
Hormuz vessel crossings back up to 44
and climbing as crude prices continue to fall:
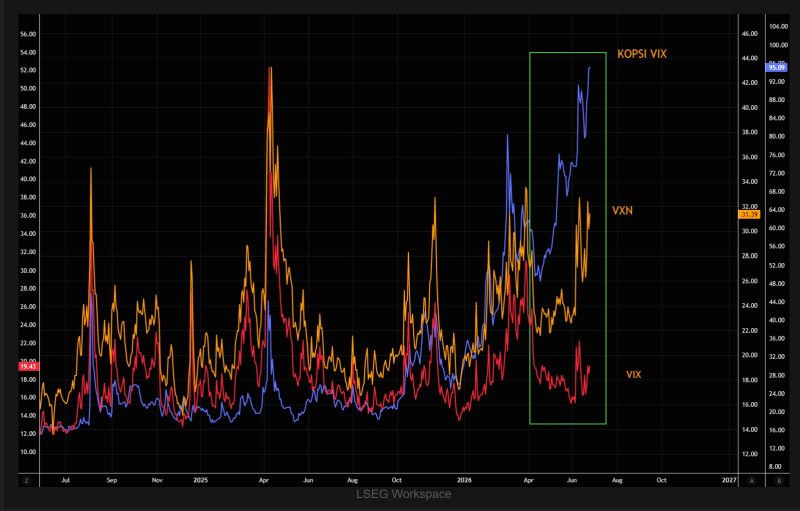
Today's vol regime explained in one chart
This chart explains today's volatility regime remarkably well. Massive leverage and extreme AI speculation continue to drive global tech volatility, with Korea's KOSPI remaining the epicenter of the mania. First KOSPI VIX Then Nasdaq volatility And finally the "boring" VIX... Source: TME
BREAKING: OpenAI advisers are pushing Sam Altman to delay its IPO until next year, per New York Times
Advisers have reportedly cautioned that OpenAI could suffer from a lack of enthusiasm from retail investors. Source: Trend Spider, NYT
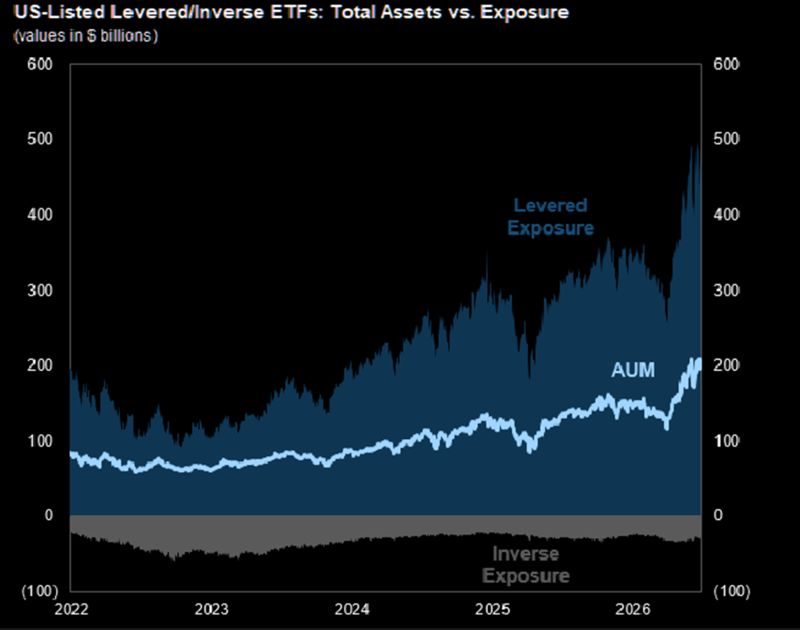
Leveraged ETFs are no longer a niche product.
US-listed funds now hold around $200 billion in assets, equivalent to roughly $400 billion of market exposure, while trading volumes are running about 50% above last year's record pace. Market structure increasingly matters. Source: TME, JP Morgan
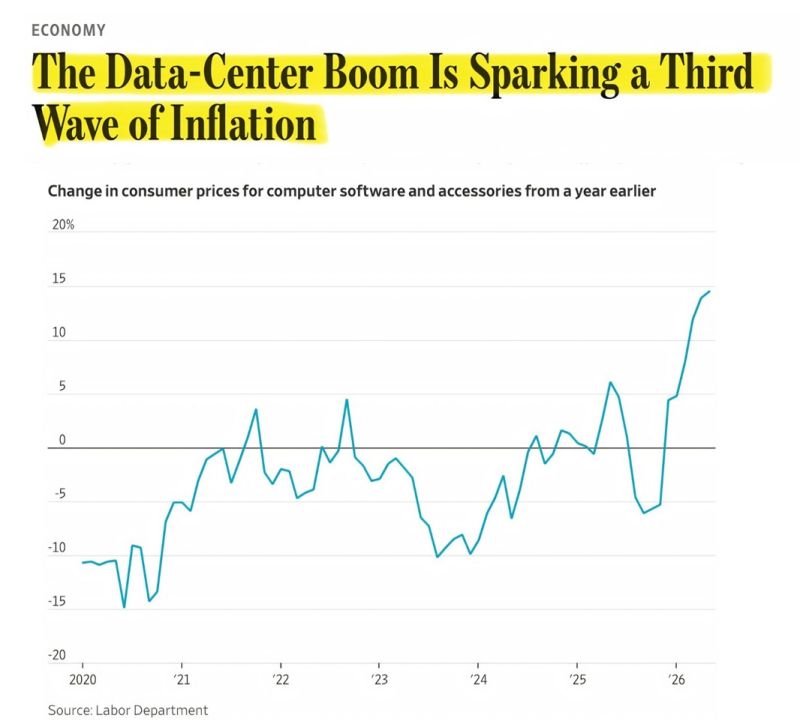
AI MAY BE TRIGGERING THE THIRD WAVE OF INFLATION.
Even Tim Cook recently said the current cost pressures are unlike anything he's seen in more than 40 years in the business. The first inflation wave came from supply chain disruptions. The second was driven by tariffs and energy prices. But this third wave could be different. Tariffs can be negotiated. Oil prices eventually fall as supply catches up. AI infrastructure spending doesn't work that way. This isn't a temporary supply shock. It's a massive demand shock that's still in its early stages. The five largest hyperscalers are expected to spend roughly $741 billion on AI infrastructure this year—up about 75% from last year. Much of that investment hasn't even translated into physical deployments yet. That means today's price pressures may be the beginning, not the peak. Here's why. AI requires enormous amounts of high-bandwidth memory and advanced chips. Those same components are also used in smartphones, laptops, gaming consoles, automobiles, and countless other electronics. As AI companies absorb a growing share of the available supply, they aren't just increasing the cost of AI—they're putting upward pressure on prices across the broader electronics market. We're already seeing signs of that. Apple and Microsoft recently raised prices on products including MacBooks, iPads, and Xbox consoles while pointing to higher component costs and memory constraints. Nintendo and Sony had already announced similar price increases weeks earlier. This isn't one company passing through higher costs. It's an entire hardware industry repricing around the same supply bottleneck. The Federal Reserve's long-term assumption is that AI will eventually offset these inflationary pressures through productivity gains. That may ultimately prove true. But several analysts, including UBS, argue those productivity benefits could take years to fully materialize, while the cost increases are happening today. That leaves the Fed facing a difficult balancing act: keeping interest rates elevated through a period where the technology expected to reduce inflation over the long run may be contributing to higher prices in the short run. If that's the case, this inflation cycle may prove more complex than the tariff- and energy-driven shocks policymakers have dealt with so far. Source: Bull Theory on X
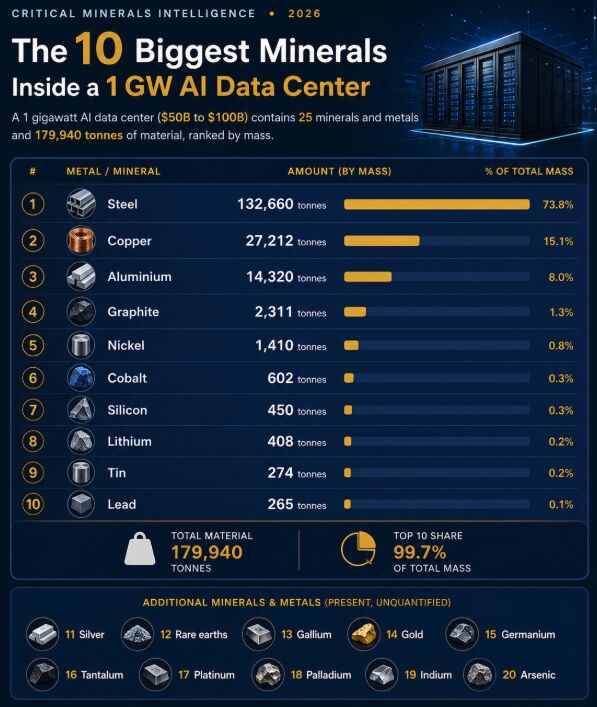
A single AI data center consumes 27,000 tonnes of COPPER.
Everyone talks about AI chips. Almost nobody talks about the metals underneath them. A 1-gigawatt AI data center requires: • 179,940 tonnes of raw materials • 25 different minerals • 132,660 tonnes of steel (74% of the total) • 27,212 tonnes of copper (15% of the build) Copper isn't just another input. It's the circulatory system of AI. Every server. Every rack. Every transformer. Every kilometer of cable. Without copper, AI doesn't run. Then come the other critical materials: → Aluminium: 14,320 tonnes → Graphite → Nickel → Silicon → Cobalt → Lithium → Tin → Lead The top 10 materials account for 99.7% of the total mass. And that's before you add the strategic minerals: • Rare earth elements • Gallium • Germanium • Tantalum • Indium Now zoom out. Hundreds of AI data centers are being built around the world. Every new gigawatt of AI compute means tens of thousands of tonnes of copper have to be mined, refined, and delivered. The AI revolution isn't just a software story. It's a commodities story. And that makes copper miners some of the biggest hidden winners of the AI boom. Before AI can scale... it needs metal. Source: Jack Prandelli on X