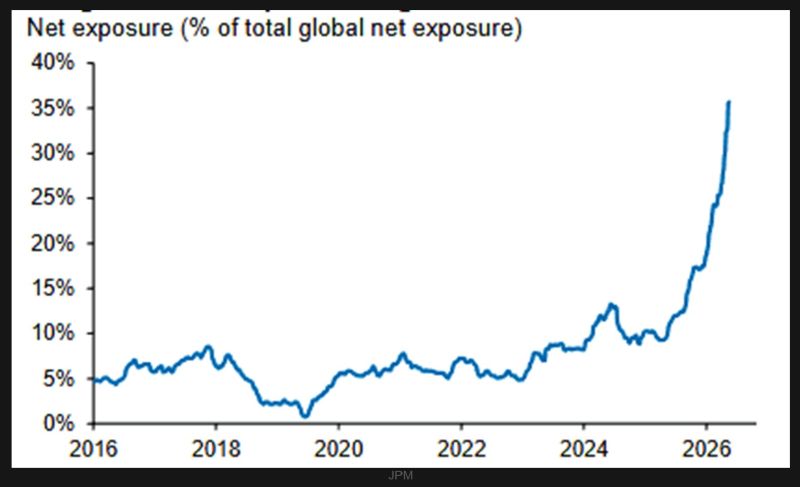
Hedge funds are all in on the semis long trade.
Source: JPM
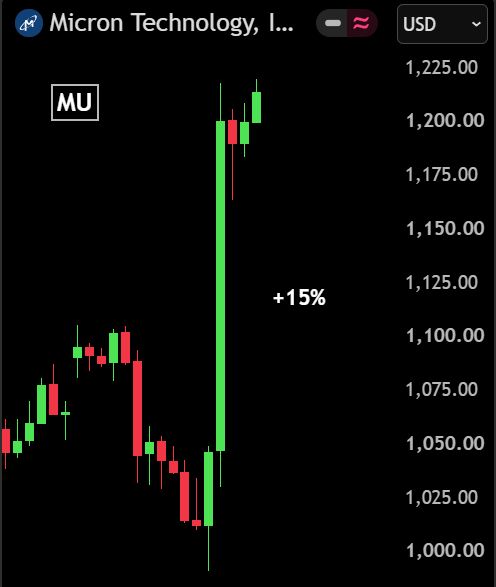
Micron just delivered one of the biggest earnings beats in semiconductor history.
The numbers are staggering: • Revenue: $41.46B vs $36.3B expected (+14%) • Adjusted EPS: $25.11 vs $21.05 expected (+19%) • Gross Margin: 84.6%, up from 37.7% a year ago 📈 Shares jumped +15% in after-hours trading. But the real story isn't this quarter. It's what's coming next. Micron's guidance absolutely crushed Wall Street: ➡️ Q4 Revenue: $50B vs $43B expected ➡️ Q4 EPS: $31 vs $25.07 expected ➡️ Gross Margin: 85% vs 84% expected The AI memory boom is accelerating faster than almost anyone expected. Micron also announced $22 BILLION in multi-year customer supply agreements, including: • Take-or-pay contracts • Customer cash deposits • Pricing floors Even more remarkable: 🔥 HBM3E and HBM4 production is already fully booked through 2027. 🔥 Demand is now extending into 2028. That's an extraordinary level of visibility for the AI infrastructure cycle. Here's the perspective that really stands out: Micron generated more profit this quarter than Nvidia made almost exactly one year ago. Yet Micron still trades at roughly a $1.1 trillion market cap. The AI infrastructure buildout isn't slowing down. If anything... It's accelerating. The AI race is no longer just about GPUs. Memory has become one of the biggest bottlenecks—and one of the biggest winners. The semiconductor cycle has entered a completely different phase. Source: Bull Theory
How does it do it?
Source: Morning Brew
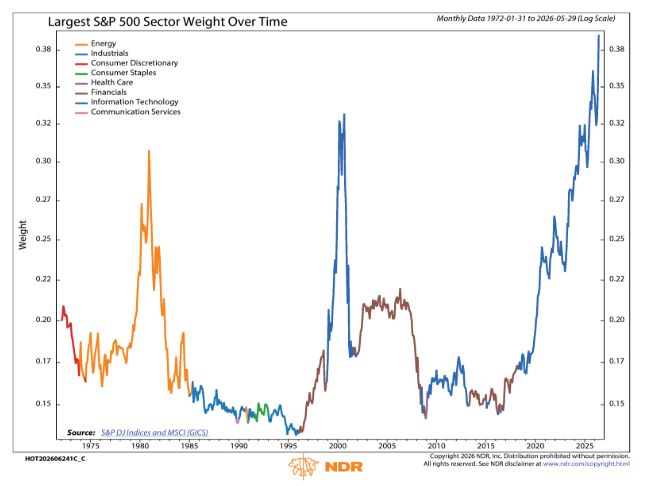
The largest sector in the S&P 500 since 1972.
Source: NDR, Rob Anderson
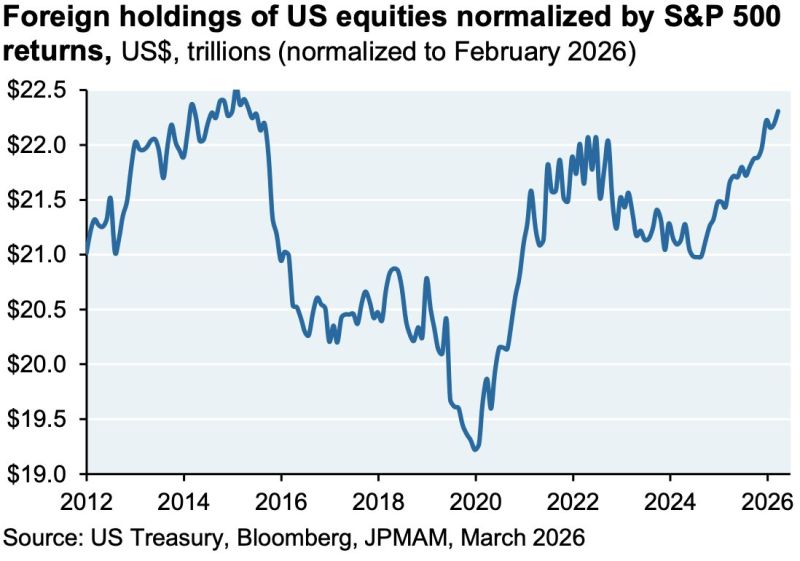
Foreign holdings of U.S. stocks have only kept rising since we first started hearing about the 'sell America' trade last year
Source: Gunjan Banerji, JP Morgan
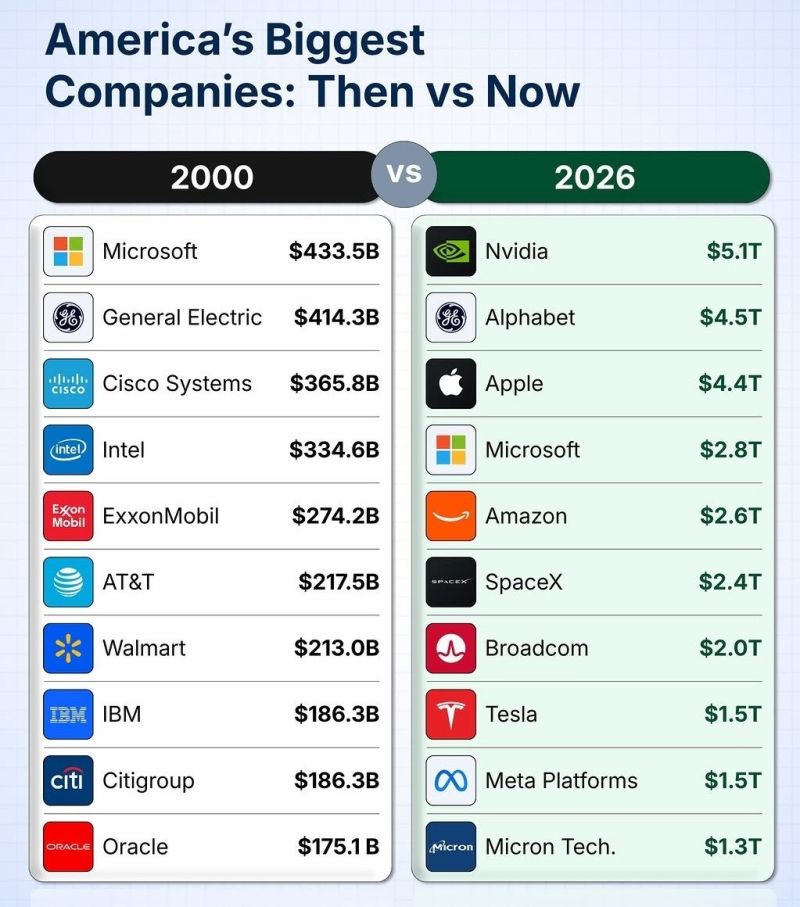
America's Biggest Companies in 2000 Vs 2026
Source: The Market Mind
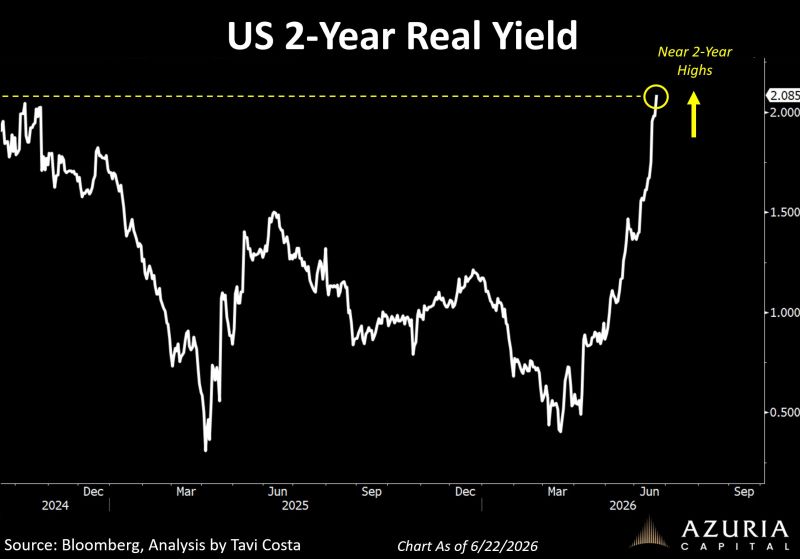
Real yields continue to go vertical. Now at two-year highs.
In an economy facing a mountain of debt, this is not a great development... The new Fed Chair does not have an easy job... Source: Tavi Costa
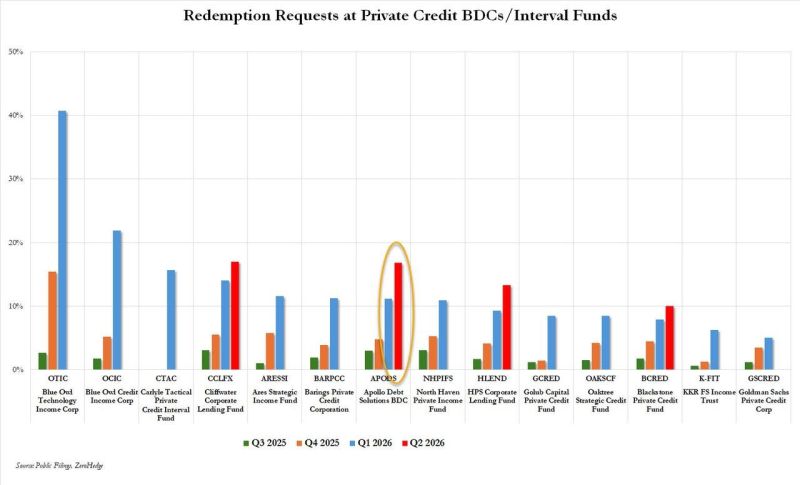
Private Credit redemptions requests keep rising and BDC gates persist: Apollo was latest
Source: zerohedge