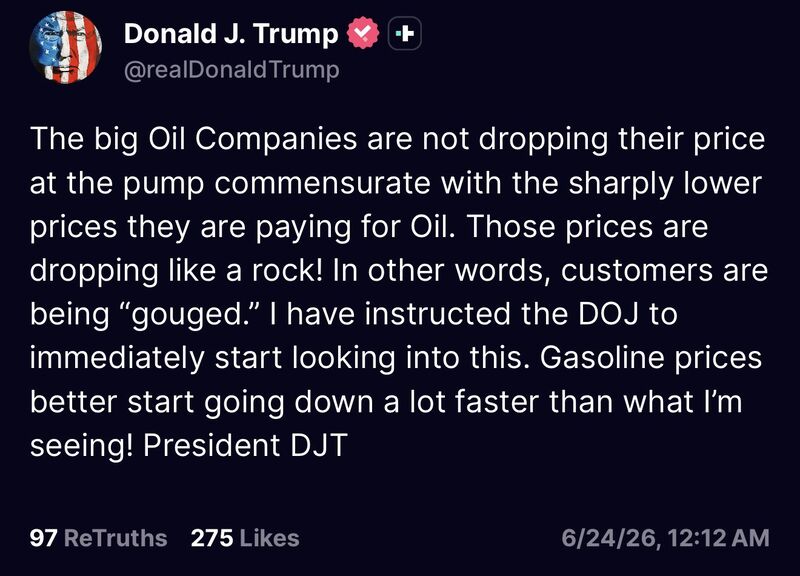
President Trump says he has instructed the DOJ to begin looking into “big Oil Companies” who “are not dropping their price at the pump”
“Customers are being ‘gouged’” he added Source: Trend Spider
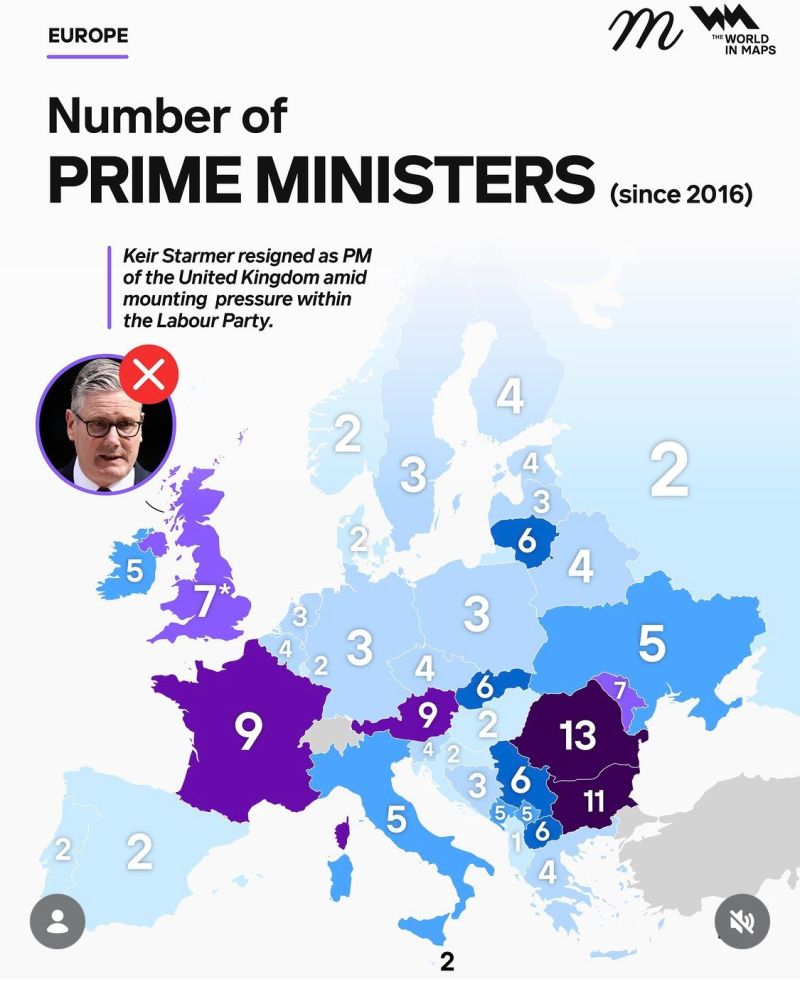
The UK is not the only country in Europe recording a big turnover at the top...
Source: World in map on X
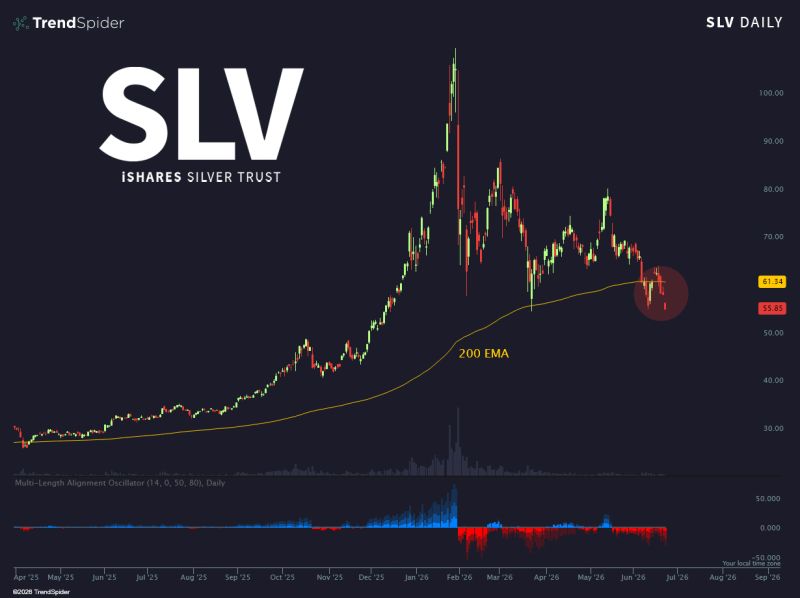
Ouch 🩸
Silver $SLV is in the midst of a 200EMA breakdown Source: Trend Spider
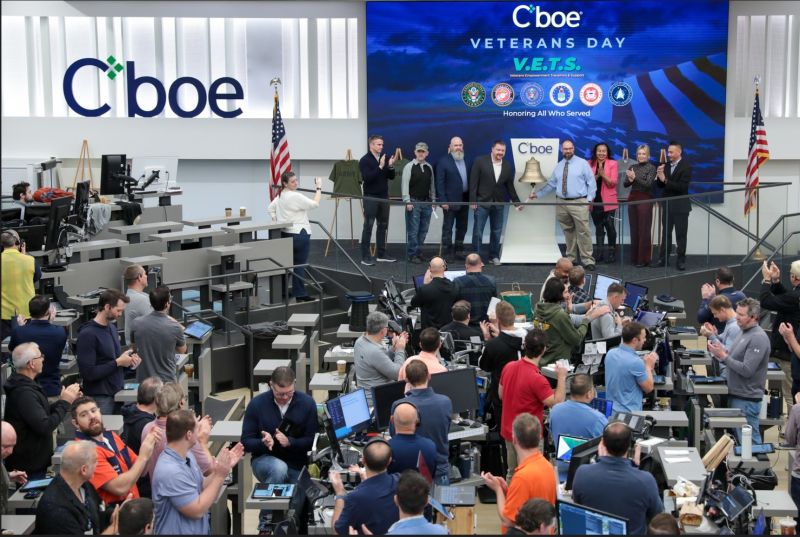
Cboe $CBOE just relaunched binary options on the S&P 500
The product is simple: you choose yes or no on whether the S&P 500 will hit a certain level in the near term. The contracts are listed on the Mini SPX index. Cboe first launched binary options on the S&P 500 and VIX back in 2008 but pulled them after failing to attract investor interest - SeekingAlpha Source. Evan
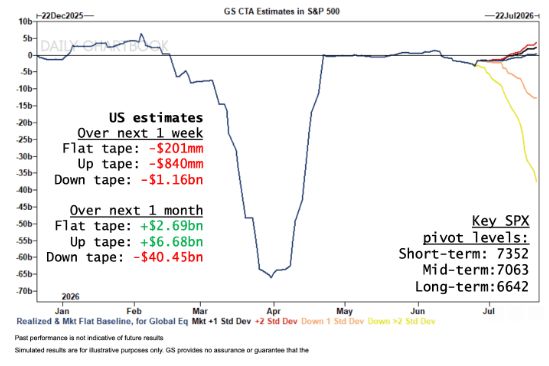
CTAs are projected to dump stocks in EVERY SINGLE SCENARIO over the next week
Source: Barchart, Goldman Sachs
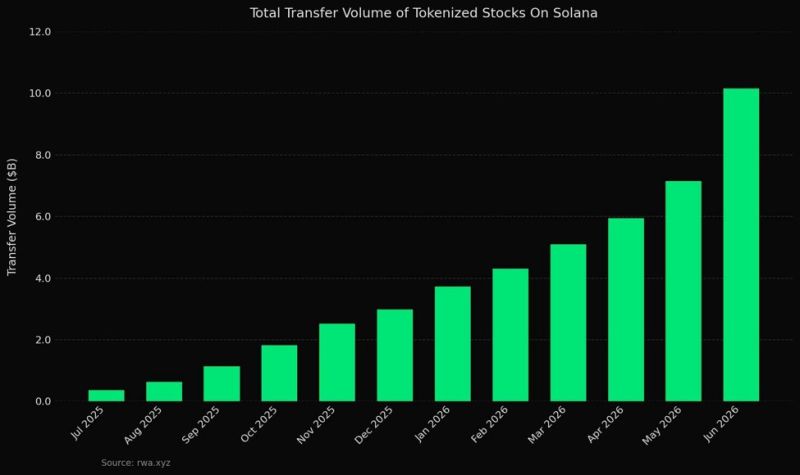
Wall Street closes. Tokenized markets don't.
The era of 24/7 equity trading is no longer a vision—it's happening. The numbers are staggering: 📈 Monthly tokenized stock trading volume reached a record $5.3 billion last month, up 44% month-over-month. ⚡ On Solana, cumulative tokenized stock transfers have officially surpassed $10 billion for the first time. 🚀 In just one month, tokenized equity trading on Solana surged 180%, fueled by growing demand for tokenized real-world assets (RWAs). Even more telling: One-third of traders are now active over the weekend. Think about that. For over a century, stock markets have operated on bankers' hours. Tokenization is rewriting the rulebook. Markets are becoming: • Global • Instant • Borderless • And increasingly... always on. The biggest innovation isn't simply putting stocks on the blockchain. It's removing the concept of market hours altogether. The future of capital markets may not be defined by what gets tokenized... but by the fact that markets never sleep.
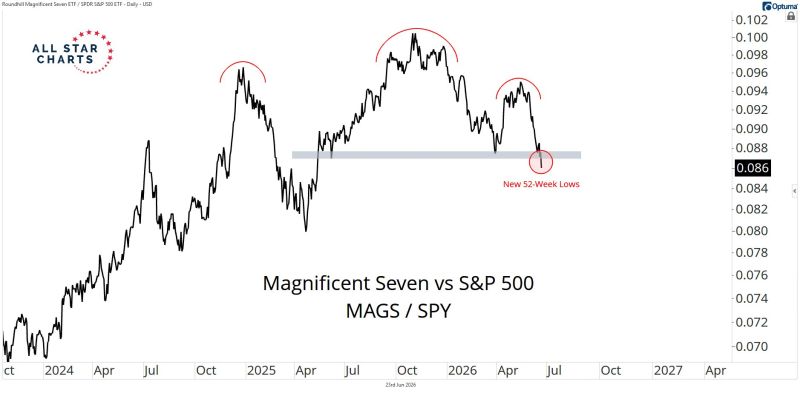
The Mag 7 continue to hit new 52-week lows relative to the broader market.
Source: Alfonso De Pablos, CMT
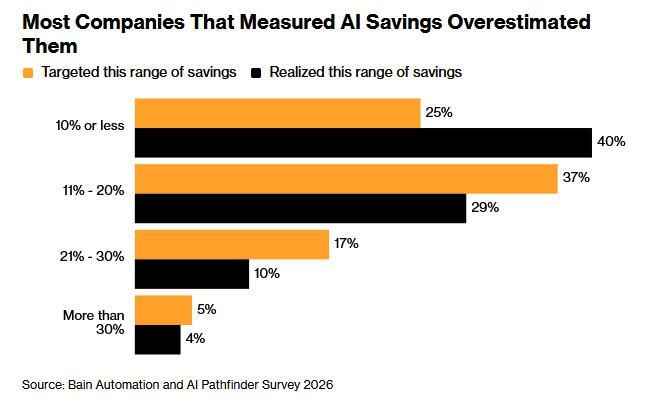
One statistic says everything about today's AI boom:
44% of large companies are funding their next wave of AI investments with savings from AI... that haven't happened yet. — Bain & Company Let that sink in. Almost half of large enterprises are reinvesting projected AI efficiencies before those efficiencies actually exist. That's not necessarily innovation. That's optimism. History has seen this movie before. Every transformational technology—from railroads to the internet—created enormous long-term value. But it also created bubbles where expectations outran reality. AI will absolutely reshape industries. That doesn't mean every AI investment, every AI startup, or every AI stock will justify today's valuations. The winners will survive. Many won't. Markets price the future, not the present. And when expectations become detached from execution, gravity eventually returns. The lesson? 🚀 Believe in AI. ⚠️ Be careful of AI hype. The biggest returns often come from identifying sustainable value—not chasing the last leg of a crowded trade. Innovation is real. Valuations are another story.