Straight from the Desk
Syz the moment
Live feeds, charts, breaking stories, all day long.
- All
- equities
- United States
- Macroeconomics
- Food for Thoughts
- markets
- Central banks
- Fixed Income
- bitcoin
- Asia
- europe
- investing
- technical analysis
- geopolitics
- gold
- Commodities
- Crypto
- AI
- Technology
- nvidia
- ETF
- earnings
- Forex
- china
- Real Estate
- banking
- oil
- Volatility
- energy
- magnificent-7
- apple
- Alternatives
- emerging-markets
- switzerland
- tesla
- United Kingdom
- Middle East
- assetmanagement
- amazon
- russia
- ethereum
- microsoft
- ESG
- meta
- Industrial-production
- bankruptcy
- Healthcare
- Turkey
- Global Markets Outlook
- africa
- Market Outlook
- brics
- performance
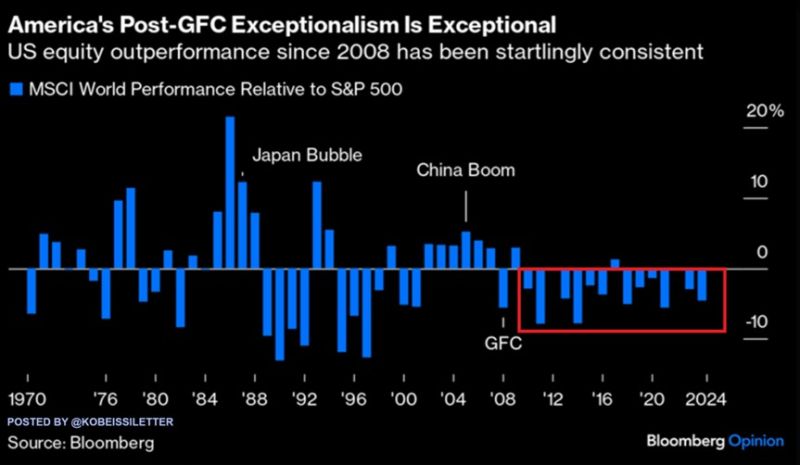
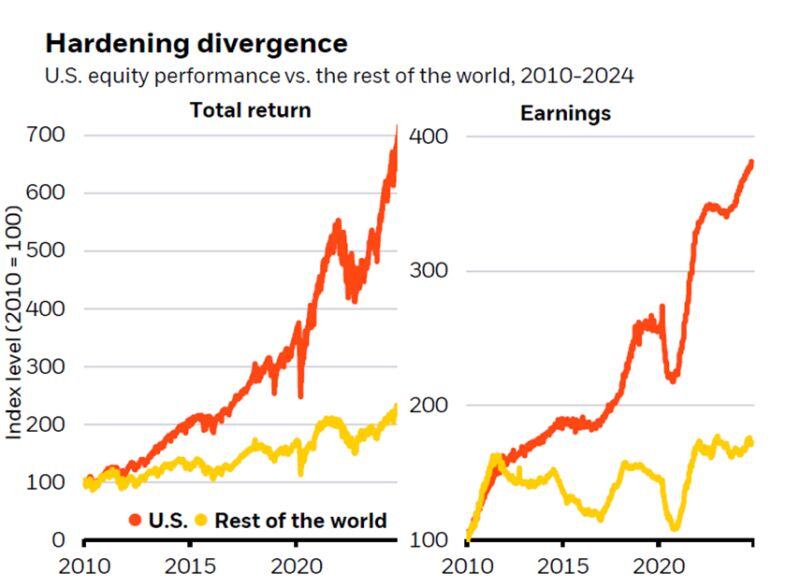
The US stock market is making history:
The SP500 is now on track to outperform global stocks for the 14th year out of the last 15. This is the longest streak in at least 75 years. During this period, the index has rallied 446%, almost DOUBLE the 229% gain of the MSCI World index. This year alone, the S&P 500 has risen 28%, beating global stocks by 6 percentage points. As a result, the US stock market now reflects a record 74% of the MSCI World Index, even surpassing the 1970s. Source: Bloomberg Opinion, The Kobeissi Letter
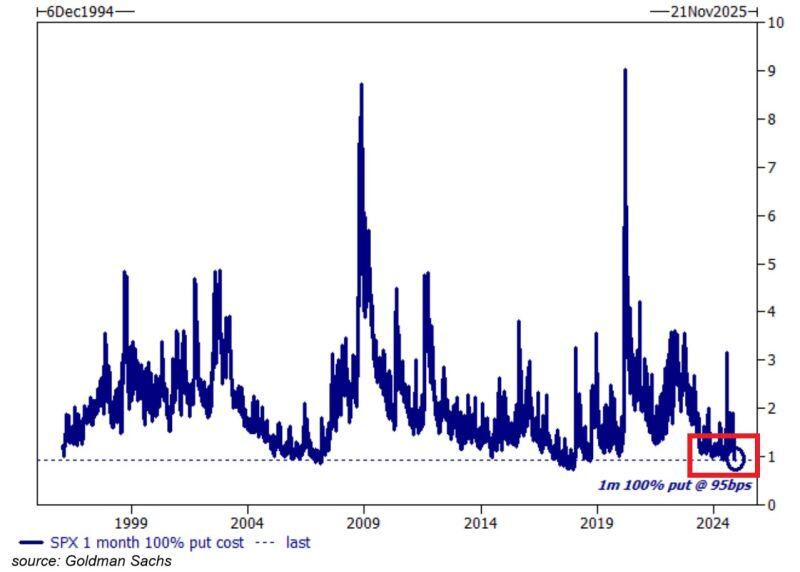
⚠️MONDAY MARKET WARNING:
There were only 2 times in history when the cost of hedging for a month against S&P 500 drop was lower than now. This means these put options will profit if the SP500 falls by at least 50 points at any time over the next month. Source: Global Markets Investor
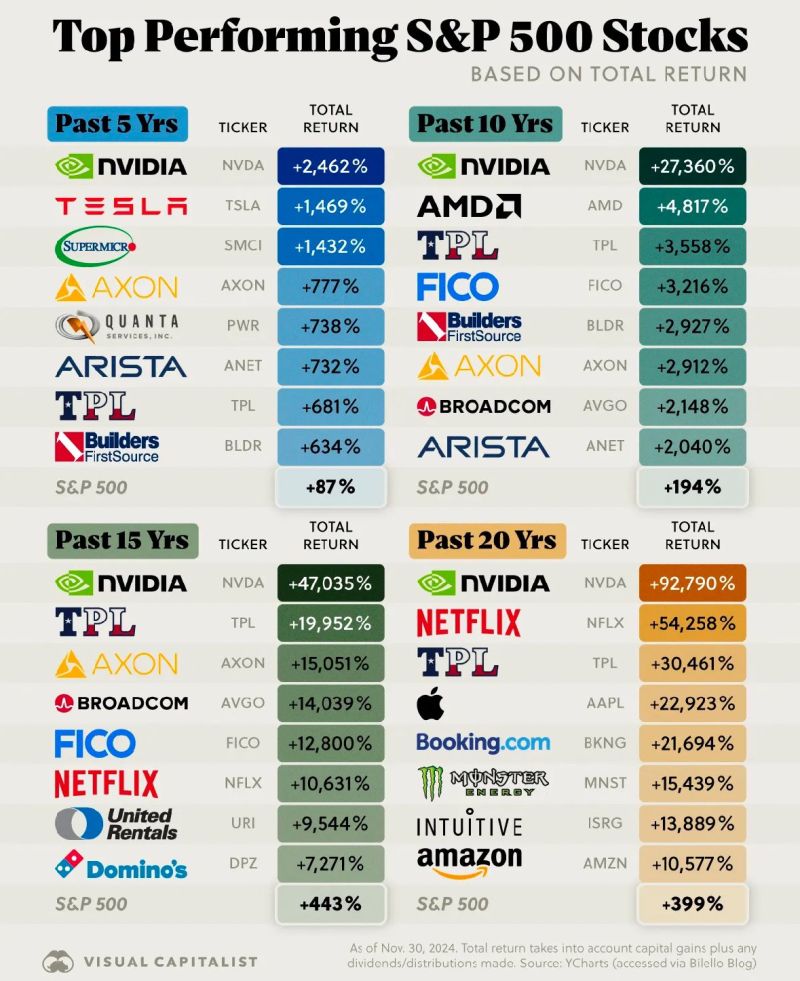
Nvidia $NVDA is the best performing S&P 500 stock over the last 5, 10, 15 and 20 years😲
Source: Evan @StockMKTNewz
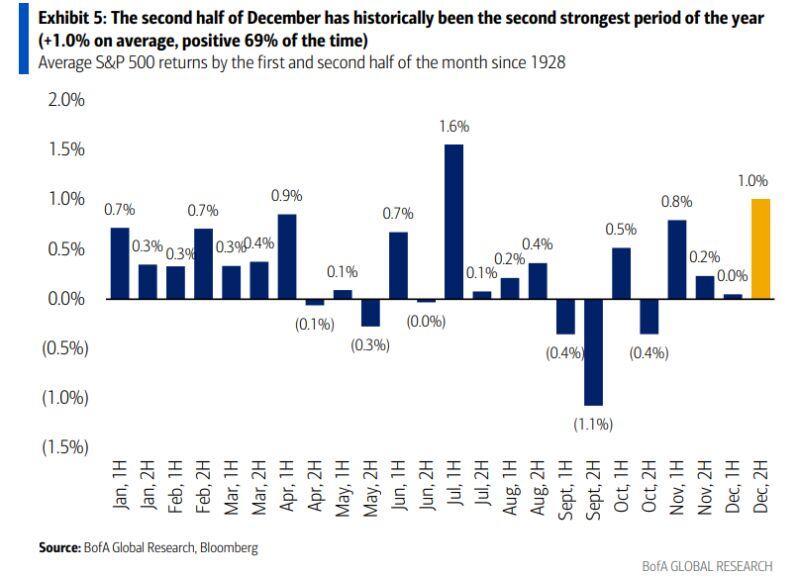
BofA: The second half of December has historically been the second strongest period of the year (+1.0% on average, positive 69% of the time)
Source: Mike Zaccardi, CFA, CMT, MBA
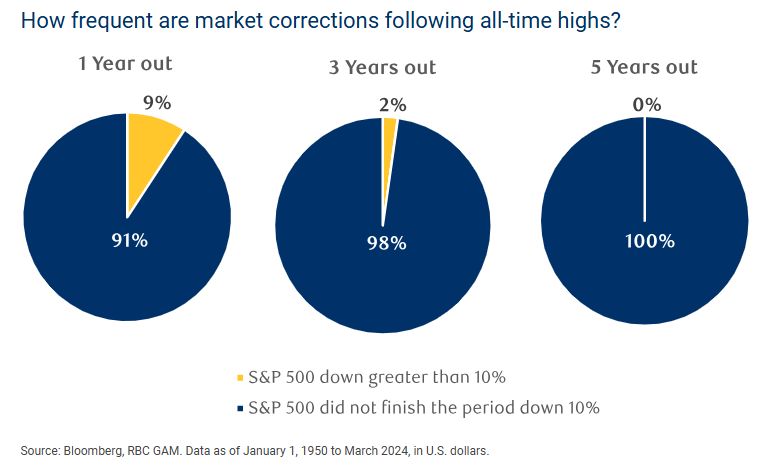
How frequent are market corrections following all-time highs?
Source: Mike Zaccardi, CFA, CMT, MBA
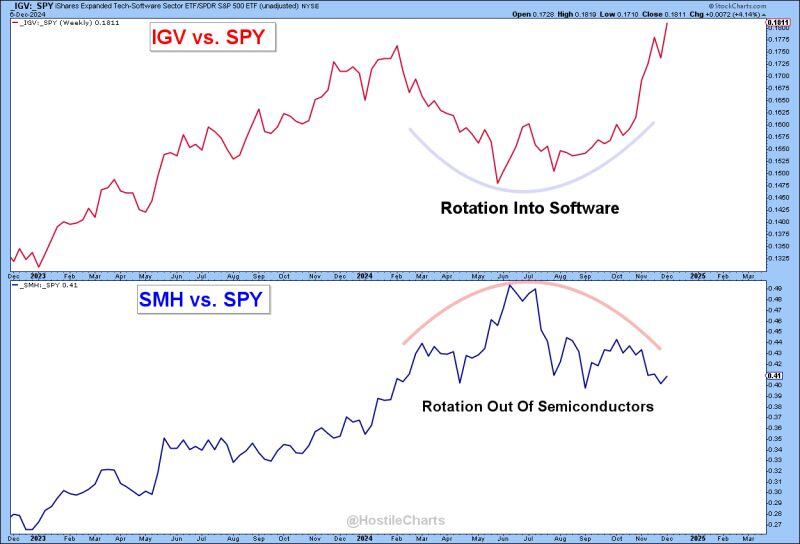
"Rotation is the Lifeblood of a Bull Market"
As Semis $SMH cooled off, they handed the baton to Software $IGV. The result? $XLK closed at new ATHs this week. Software & Semis now carry roughly equal weight in the S&P 500 $SPY. Source: Larry Thompson, CMT CPA @HostileCharts
Investing with intelligence
Our latest research, commentary and market outlooks


