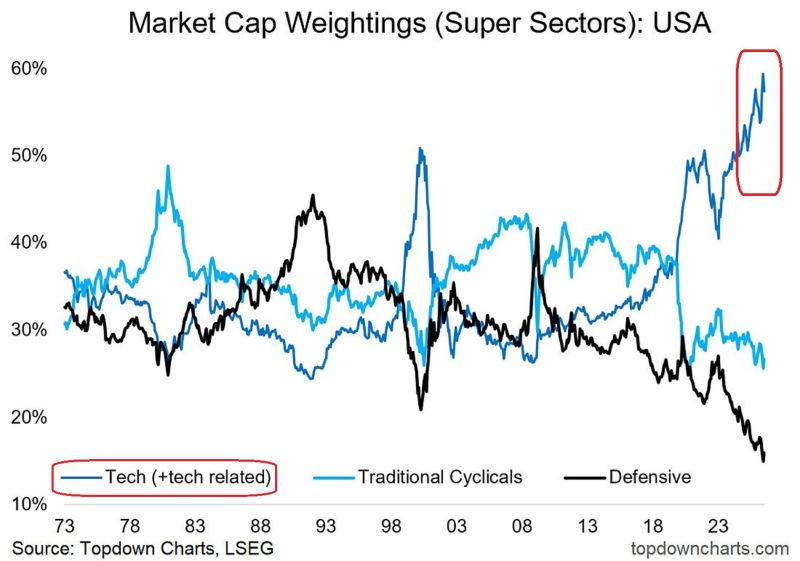
This is the AI leaders-vs-laggard basket
Source: zerohedge, Bloomberg
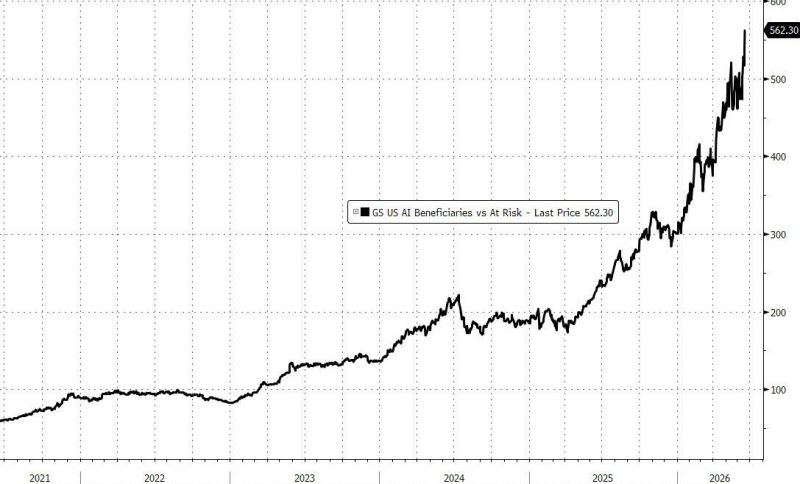
The Memory ETF is now the fastest ETF in history to hit $10 billion, $15 billion, and $20 billion in assets under management.
Source: Charlie Belillo
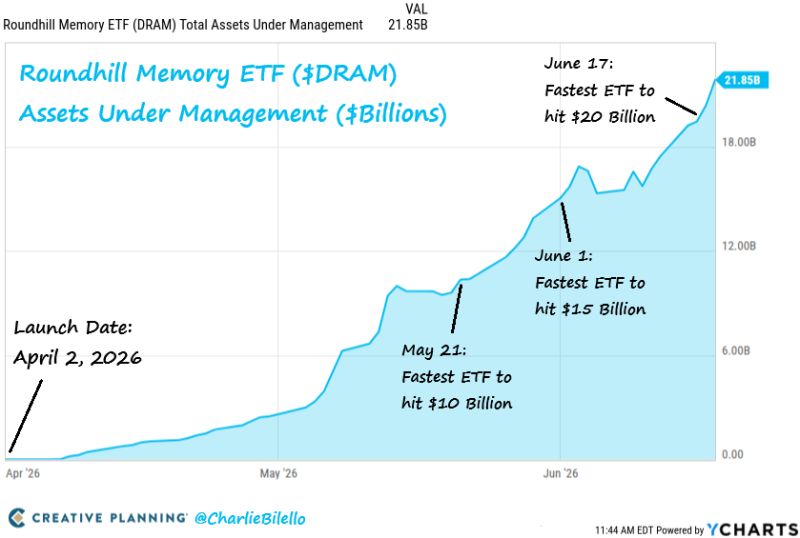
S&P 500 and Nasdaq-100 rebalances take effect before Monday’s open, June 22.
S&P 500 adds $MRVL and $FLEX; removes $POOL and $CPB. Nasdaq-100 adds $ALAB, $CRWV, $NBIS, $RKLB and $TER; removes $CHTR, $CTSH, $INSM, $VRSK and $ZS. Source: Wall St Engine
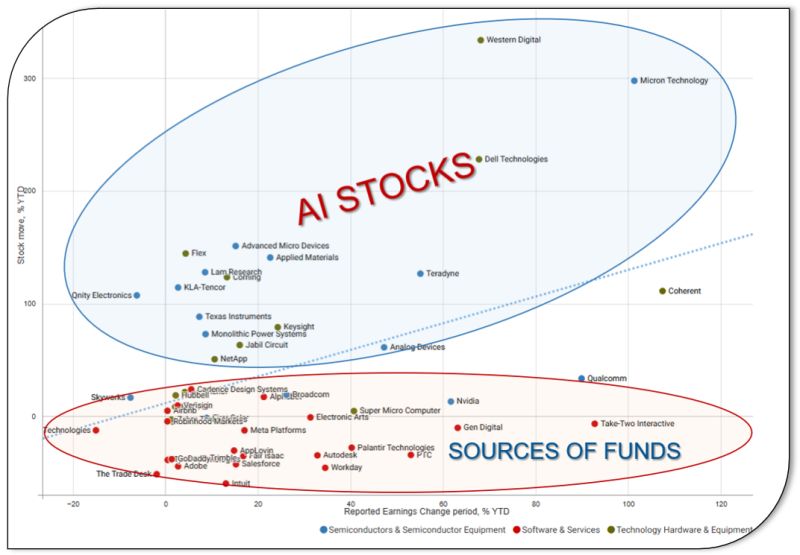
There are 2 markets currently 1) The AI stocks; 2) The sources of funds to buy the AI stocks
This scatterplot chart below shows that earnings do matter for AI-themed stocks, but for the rest of the Technology universe, earnings really don't matter YTD. Source: Konstantin Fominykh
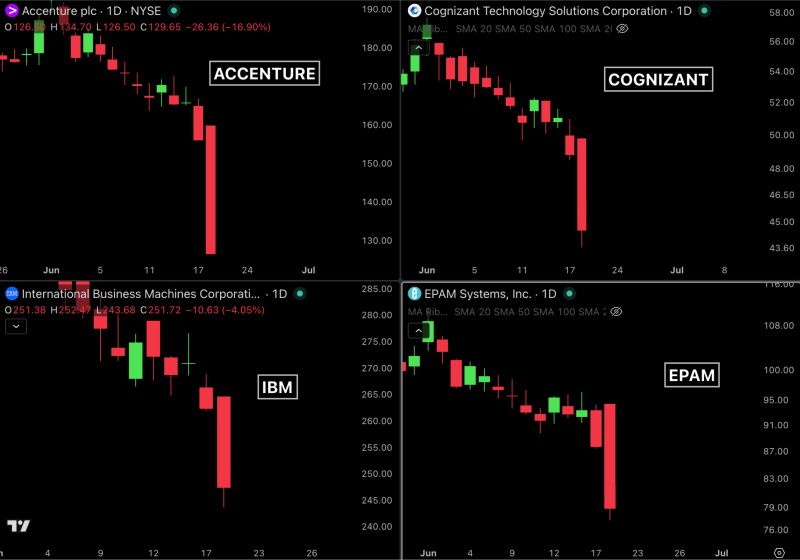
MASSIVE BLOODBATH IN THE IT OUTSOURCING SECTOR.
Accenture reported earnings this morning and cut its full-year revenue forecast. Its quarterly bookings fell 2% and the stock crashed 18%. Accenture is the largest IT services company in the world, so when it reports weak demand, every other company in the sector falls with it. Cognizant fell nearly -8%. Wipro fell nearly -8%. Capgemini fell -8.4% to its lowest price in a year. IBM fell -4%. EPAM dropped to near a 52-week low. Two things are driving the selloff. Companies are spending less on IT consulting as the economy slows, and the market now believes AI is starting to do the work these companies used to charge billions for. Both pressures hit the same business model at the same time. This is a direct problem for India. Indian IT has been one of the only sectors holding up the Nifty. TCS, Infosys, HCLTech, and Wipro have been carrying the index. These companies run on the same model as Accenture and earn most of their revenue from US and European clients. Accenture's results are treated as a preview of what is coming for TCS and Infosys. Their US-listed shares already fell 3 to 5% tonight. No surprise Indian markets are getting hit... Source: Bull Theory
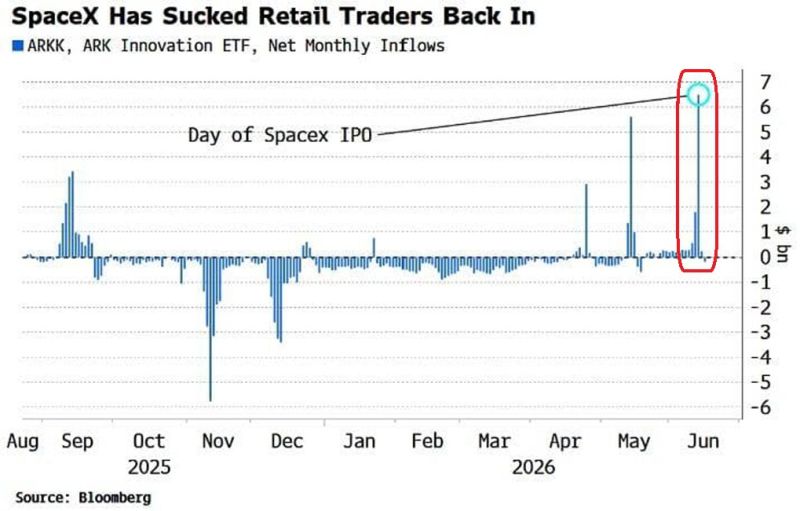
Retail investors are piling into SpaceX at an UNPRECEDENTED pace:
The ARK Innovation ETF, $ARKK, recorded ~$7 billion in inflows in June, the largest in nearly a year, with the surge coinciding precisely with the day of the SpaceX IPO. Over the first 3 trading sessions following its IPO, retail investors purchased a net $369.8 million of SpaceX, $SPCX, according to Vanda Research. By comparison, retail investors purchased just $88.2 million of Nvidia, $NVDA, over the same time. SpaceX's 3-day retail purchases roughly matched the COMBINED total of Nvidia, Alphabet, Amazon, Microsoft, Meta, the S&P 500 ETF, $SPY, and the Nasdaq 100 ETF, $QQQ. The retail mania is unlike anything seen before. Source: Global Markets Investor, Bloomberg
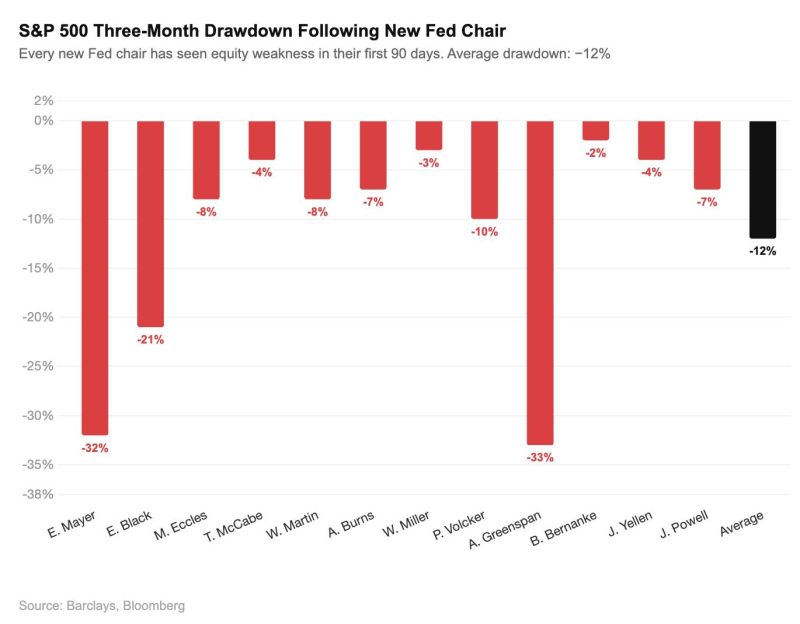
The S&P 500 has fallen under every single new Fed chair in their first 90 days.
Kevin Warsh chairs his first FOMC meeting today. The historical data goes back nearly a century across 12 Fed chairs. The average drawdown in the first three months of a new Fed chair is -12%. The worst was Alan Greenspan at -33%. The best was Ben Bernanke at -2%. Jerome Powell's first 90 days saw a -7% drawdown. Janet Yellen's saw -4%. Not one single new Fed chair has avoided a drawdown in their first three months. Warsh's 90-day clock starts today. Source: Bull Theory
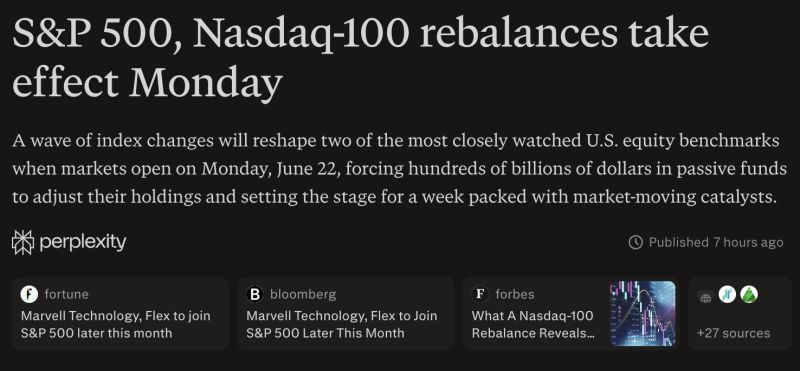
US tech and tech-related stocks now reflect nearly 60% of the total stock market cap, an all-time RECORD.
At the same time, defensive stocks account for just 15%, an all-time LOW. Not even the 2000 Dot-Com BUBBLE saw such a divergence with tech peaking at ~50% while defensives remained above 20%. Has a new era of equity market performance come, or are defensive stocks going to catch up over the years? Source: Topdown charts, Global Markets Investor @GlobalMktObserv