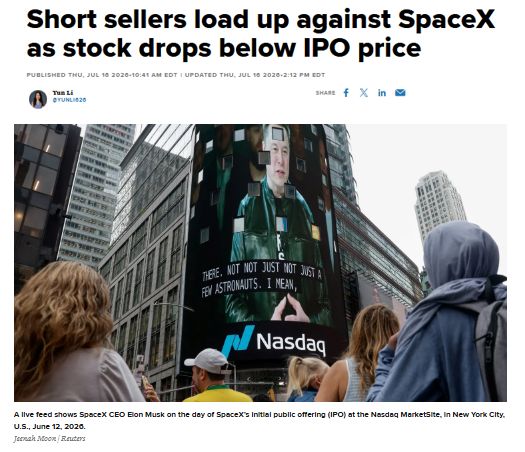
SpaceX $SPCX short sellers have now built a position equal to roughly one third of the company's public float, worth about $25 Billion
Source: Barchart
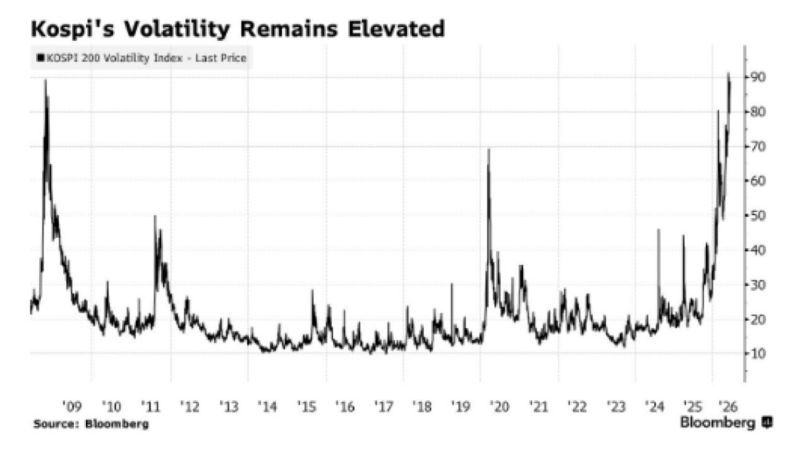
South Korea Stock Market volatility hits highest level in history, surpassing the Global Financial Crisis
Source: Barchart, Bloomberg
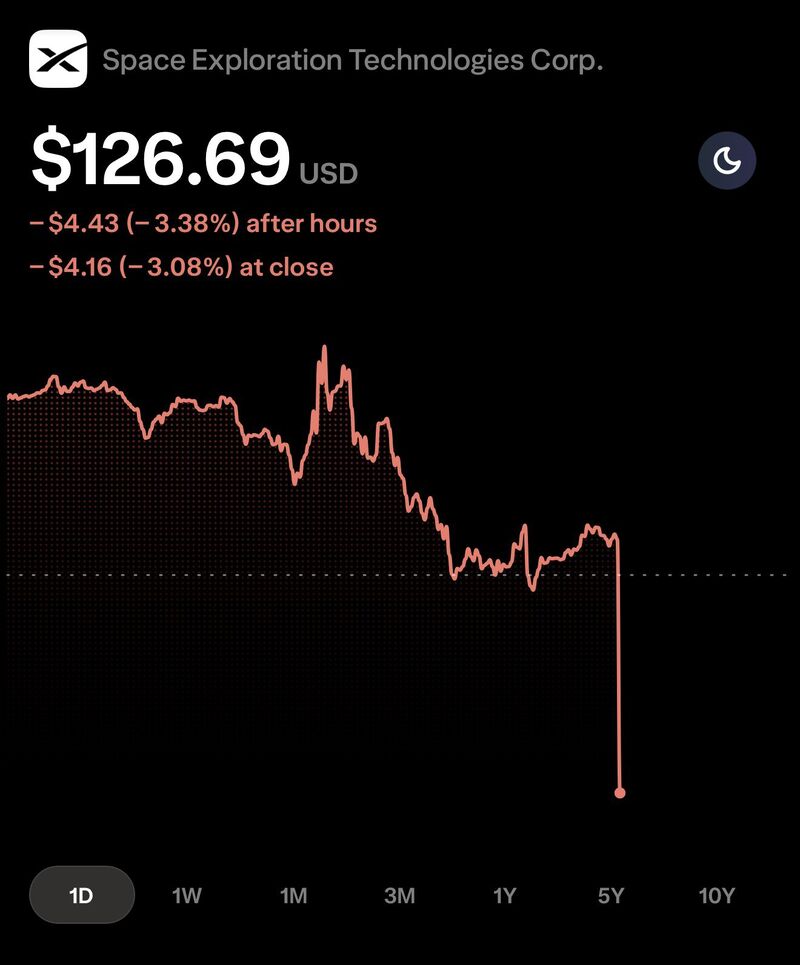
SPACEX HAS JUST CALLED OFF IT’S MAJOR TEST MISSION OF STARSHIP ROCKET AT THE LAST MOMENT
$SPCX Source: Gurgavin on X
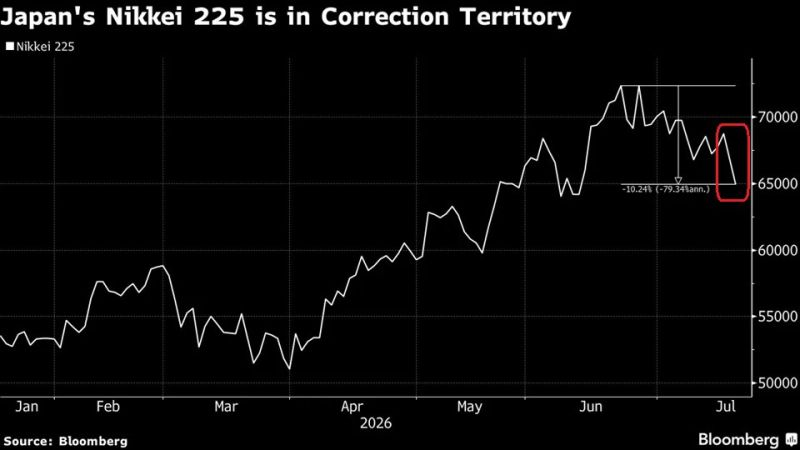
JAPANESE STOCKS JUST ENTERED A TECHNICAL CORRECTION:
The Nikkei 225 dropped -4% on Friday, now more than -10% below its June 25 peak, marking a technical correction and its worst weekly loss since April 2025. The broader Topix fell -2.7%, with Tokyo Electron alone contributing the most to the decline after sliding -8.2%. Market breadth was weak, with 810 stocks falling versus 788 rising and 39 unchanged. This comes as investors grow increasingly concerned that AI-related capex is outpacing returns, after Taiwan Semiconductor, $TSM, fell despite raising both its spending and revenue targets, mirroring Samsung's selloff earlier this month despite beating earnings estimates. Kioxia Holdings led the losses, plunging -16%, its biggest one-day drop since November 2025. Its market capitalization has now been cut in half in just one month after briefly becoming Japan's most valuable company. AI euphoria across semiconductor sector is unwinding rapidly. Source: Global Markets Investor
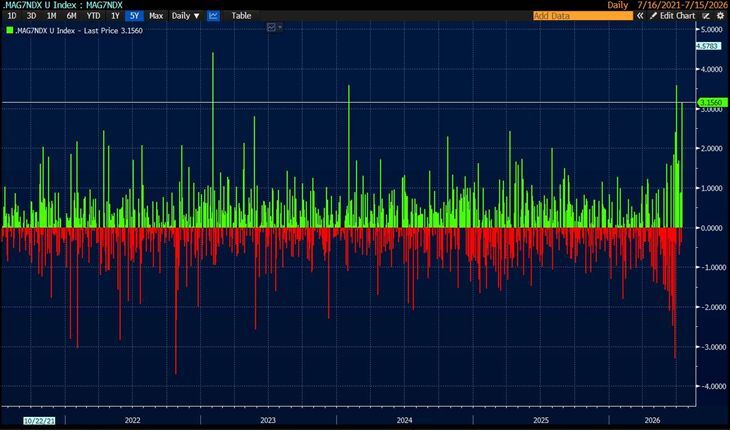
Goldman: "We are seeing a clear theme of buying Hyperscalers vs selling Semis as our Mag7 basket is outperforming NDX by nearly 3%.
Momentum (memory) drawdown continues with our pair basket (GSPRHIMO) down another -6.5% today despite the modest reprieve yday, taking MTD performance to -24% (worst month since April 2009)"
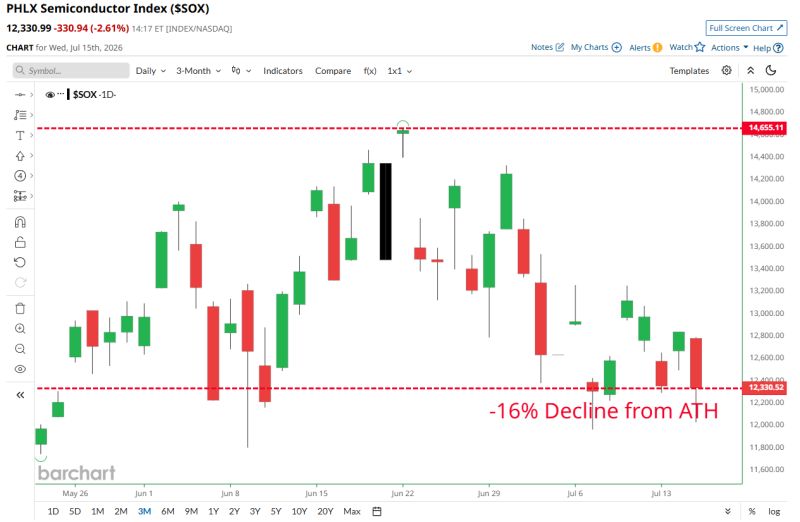
Semiconductor Stocks
Semis have entered a technical correction and are on the verge of a bear market after falling 16% from June's all-time high Source: Barchart
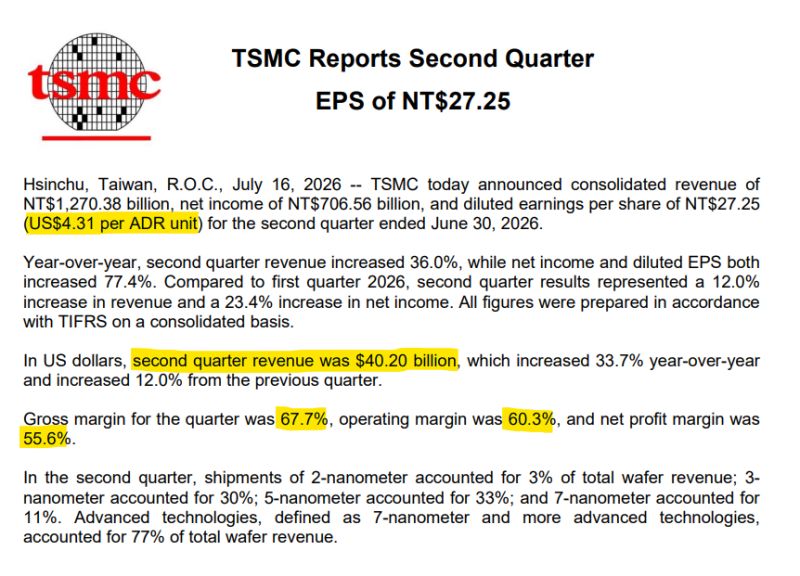
$TSM Q2 EARNINGS DOUBLE BEAT
EPS: $4.31 vs $3.77 est REV: $40.20B vs $39.76B est Gross Margin: 67.7% Operating Margin: 60.3% Net Profit Margin: 55.6% Source: Trend Spider
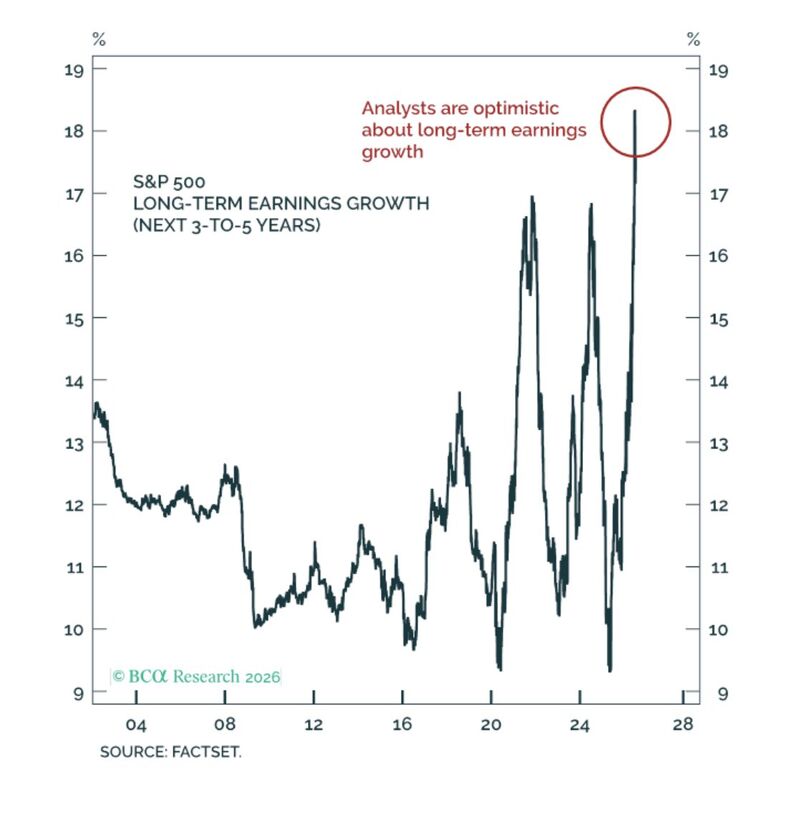
Peak optimism?
Source: Peter Berezin