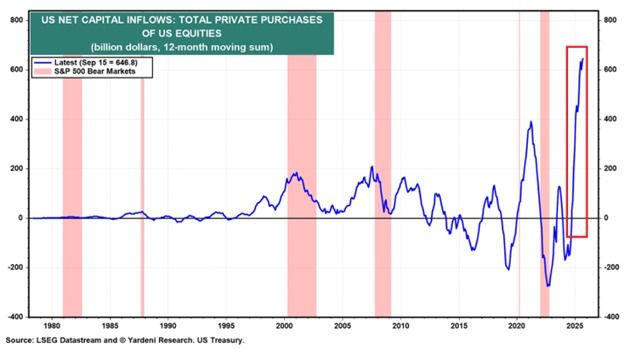
Foreign investors are buying US equities at a record pace:
Private investors outside the US purchased a record +$646.8 billion of US equities in the 12 months ending in September 2025. Purchases have doubled since the start of the year. This is now 66% ABOVE the+$390.0 billion high seen in 2021. Meanwhile, foreign private-investor purchases of US Treasuries were +$492.7 billion during the same period. Rolling 12-month non-US buying of Treasuries has remained above +$400 billion for 4 straight years. Source: The Kobeissi Letter
Nasdaq $NDAQ is making its tokenized stock plan a top priority and says it will “move as fast as we can” to get SEC approval.
The proposal, filed in September, would let investors trade on chain “stock tokens” that are just digital representations of existing listed shares, with the same ticker, CUSIP, voting rights and dividends, and target rollout around Q3 2026 under current SEC market rules. Source: Wall St Engine

The S&P 500 has been up 7 months in a row with a 20%+ gain.
Historically, what comes next after such a rally? See the anser below. On average, the S&P 500 record positive returns. But the last 2 times we had a similar streak (Sept 2009 and August 2021), the market paused a month after. Source: RBC, TheMarketStats

The good news on US equities is coming from... valuation.
Indeed, while absolute P/Es remain quite expensive, most sectors have de-rated throughout November - see chart below. When the column is red, it means that P/E has decreased in November. When it is blue, it implies that the P/E has increased. It seems that Tech and discretionary both de-rated in November Source: RBC, Bloomberg

Retail investors and Quants dominate US stocks trading
Source: Empirical research, RBC

The Russell Micro-cap Index includes the smallest 1000 securities in the Russell2000 Index, plus the next 1000 smallest eligible securities by market cap.
This index is on pace to finish November at its highest monthly close in its entire history. Risk appetite or Risk aversion? Source: J.C. Parets @JC_ParetsX

When Zoom ($ZM) was $600/sh in 2020, it had $20 million in income.
Now, Zoom is $87/sh with $2 billion in income. What does that tell you about the current AI companies? Source: Kevin Malone @Malone_Wealth

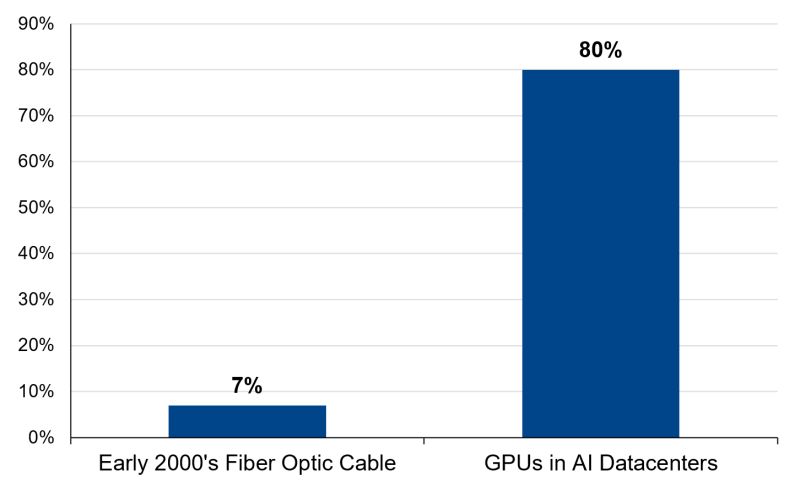
Interesting view by Shay Boloor @StockSavvyShay about why the AI cycle is nothing like the dot-com era.
"Early-2000s fiber ran at roughly 7% utilization because the industry built far ahead of demand that never showed up. The physical layer scaled faster than the software. Today is the inverse. $NVDA clusters inside $MSFT, $AMZN, $GOOGL and $META are running ~80% utilization because every model lab is capacity-constrained. The software layer is scaling far faster than the physical. One cycle had excess supply and no demand. This one has excess demand and not nearly enough supply. That’s the entire difference". ➡️ True. At least for now. But are we sure that capacity utilization will remain as high when hyperscalers would have spent trillions of dollars in additional capacity? What if demand does not pick up as much as supply??? The 7% utilization rate of fiber optics is the one which applied to the end of the cycle, once all fiber optics got built. When the telecom companies started to over-invest, they never assumed that capu would be that low at the end...