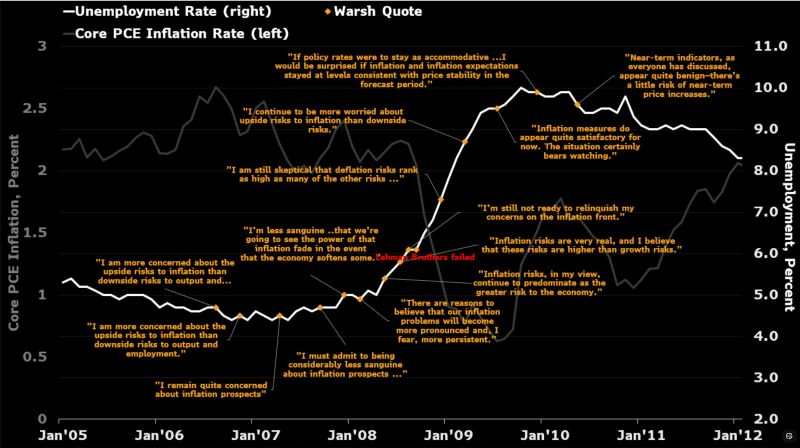
🚨 Is the market misreading the next potential Fed Chair? 🚨
If the goal is "easy on inflation," the history books tell a very different story about Kevin Warsh. Looking back at the FOMC transcripts from 2006-2011, one moment stands out that should make every investor pause. 📍 The Setting: April 2009. The world was still reeling 7 months after the Lehman Brothers collapse. - Unemployment: 9% - Core PCE Inflation: A mere 0.8% - Despite a crashing economy and deflationary pressure, Warsh’s stance was clear: "I continue to be more worried about upside risks to inflation than downside risks." The Takeaway: Warsh has historically been an "inflation hawk," even when the data suggested the opposite. If he takes the helm, we might be looking at a much more aggressive Fed than the "dovish" transition many are currently pricing in. Source: Bloomberg, Anna Wong @AnnaEconomist
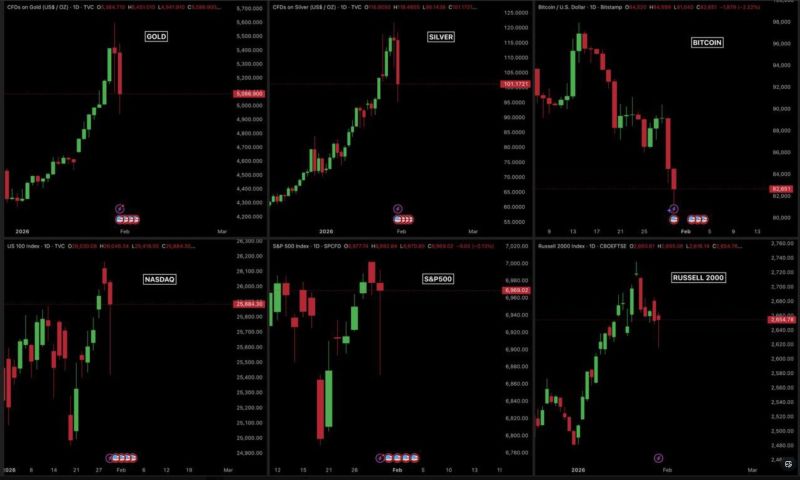
🚨 MARKET MELTDOWN: $6.5 TRILLION GONE IN 24 HOURS. 🚨
If you thought your Tuesday was stressful, take a look at the global markets. We just witnessed one of the most violent 24-hour wealth erasures in modern history. 📉 The numbers are honestly hard to process: 1️⃣ The Metals Massacre 🪙 This wasn’t just a "dip"—it was a cliff dive. - Gold: -10.9% ($4.1 TRILLION evaporated) - Silver: -21.5% - Platinum: -23% - Palladium: -20% Safe havens? Not today. 2️⃣ Tech & Equities Bleed 💻 While the indices didn't drop as far percentage-wise, the dollar amounts are staggering. - Nasdaq: -$480 Billion - S&P 500: -$380 Billion Even the "magnificent" names are feeling the gravity. 3️⃣ Crypto Chaos ₿ Digital assets followed the macro trend down. - Bitcoin: -6.6% (-$108 Billion) - Ethereum: -7.5% (-$25 Billion) Why does this matter for you? In a world of "instant liquidity" and "algorithmic trading," volatility is the new baseline. When correlations go to 1.0, everything drops at once. There was nowhere to hide today. Over $6,500,000,000,000 wiped off the map🧐 Source: Bull Theory
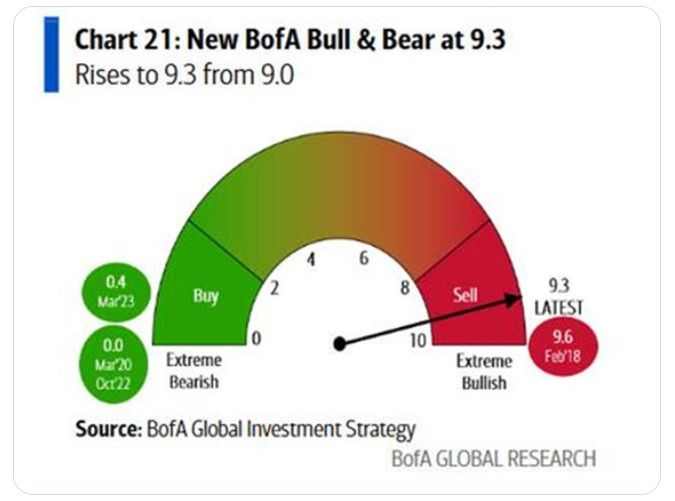
The BofA’s Bull & Bear Indicator is still flashing a sell signal (i.e too much bullishness = contrarian sell signal)
Indicators covered: 1) Hedge fund positioning: Bullish 2) Equity inflow: Very Bullish 3) Bond inflows: Bullish 4) Credit market technicals: Bullish 5) Global stock index breadth: Very Bullish 6) FMS global fund manager positioning: Very Bullish Source: BofA, Global Markets Investor
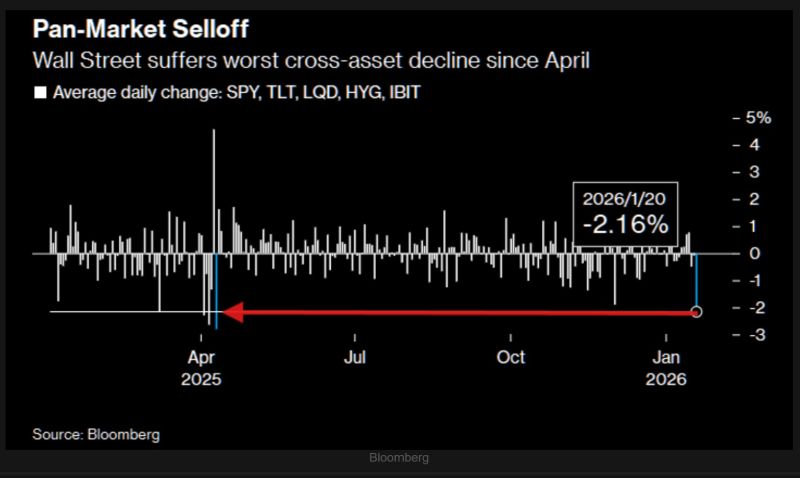
Yesterday was worst cross-asset selloff since April
Source: TME, Bloomberg
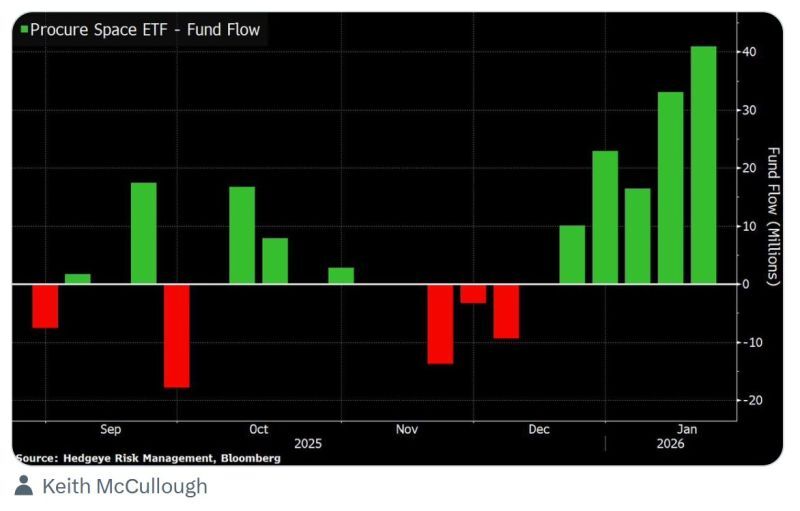
BREAKING: Procure Space, $UFO led the ETF industry in percentage growth last week.
Its weekly net inflows amounted to 18% of AUM, or $40.9 million. Space surged +7.9% higher week-over-week and is now up +22.5% YTD in 2026. Source: Hedgeye on X
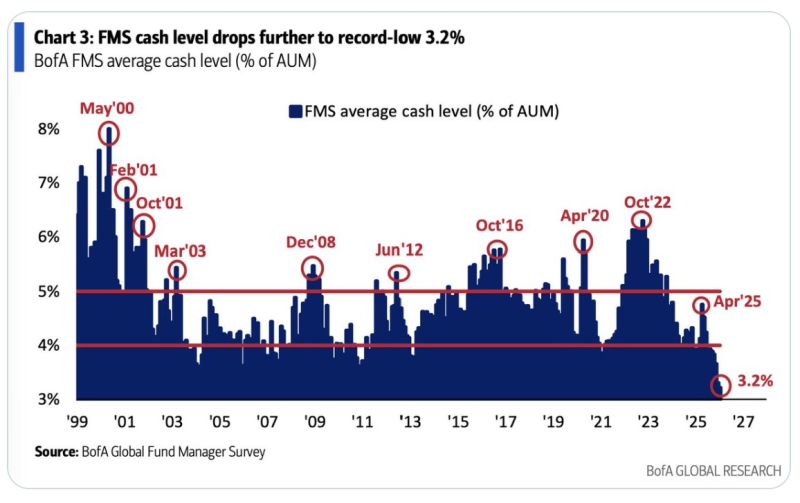
A (bearish) contrarian call?
January’s Fund Manager Survey is most bullish since Jul2021: expectations for global growth have jumped, cash levels have fallen to a record low of 3.2%, and protection against equity sell-off is at its lowest since Jan2018. BofA’s Bull & Bear Indicator flashing extreme optimism at 9.4. Source. HolgerZ, BofA
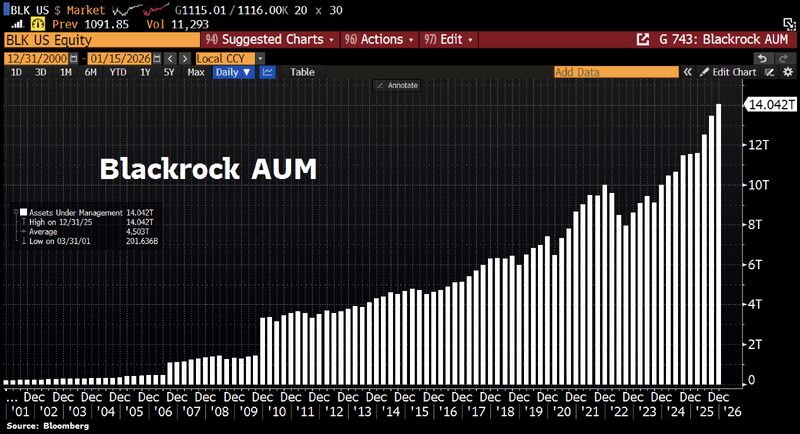
BlackRock is eating the world. Total assets under management hit a record $14 TRILLION after the firm pulled in $342bn of client money in Q4 alone.
Source: HolgerZ, Bloomberg
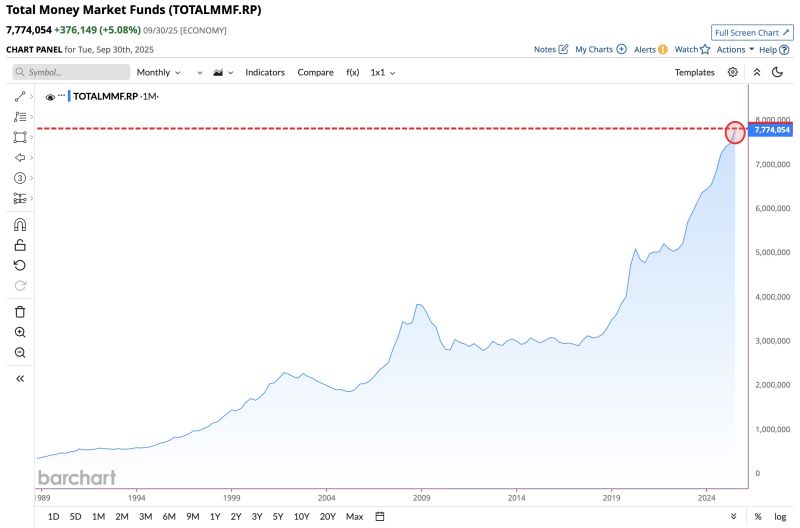
$7.8 Trillion is now sitting in Money Market Funds, a new all-time high
Source: Barchart