Straight from the Desk
Syz the moment
Live feeds, charts, breaking stories, all day long.
- All
- equities
- United States
- Macroeconomics
- Food for Thoughts
- markets
- Central banks
- Fixed Income
- bitcoin
- Asia
- europe
- investing
- geopolitics
- gold
- technical analysis
- Commodities
- Crypto
- AI
- Technology
- nvidia
- ETF
- earnings
- Forex
- china
- Real Estate
- oil
- banking
- Volatility
- energy
- magnificent-7
- apple
- Alternatives
- emerging-markets
- switzerland
- tesla
- United Kingdom
- Middle East
- amazon
- assetmanagement
- microsoft
- russia
- ethereum
- ESG
- meta
- Industrial-production
- bankruptcy
- Healthcare
- Turkey
- Global Markets Outlook
- africa
- Market Outlook
- brics
- performance
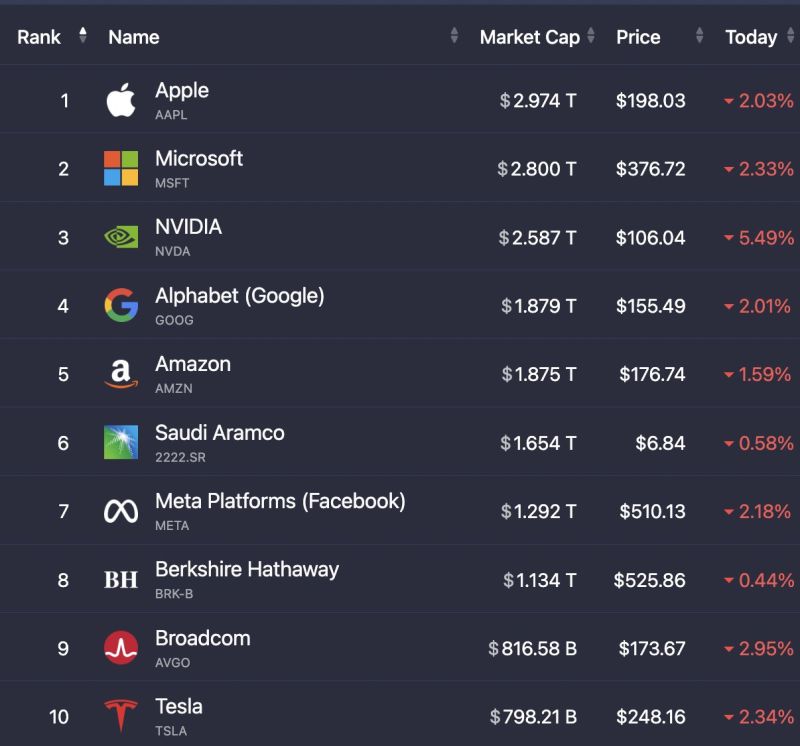
We're back to having 0 companies with a $3+ Trillion market cap
Source: Evan
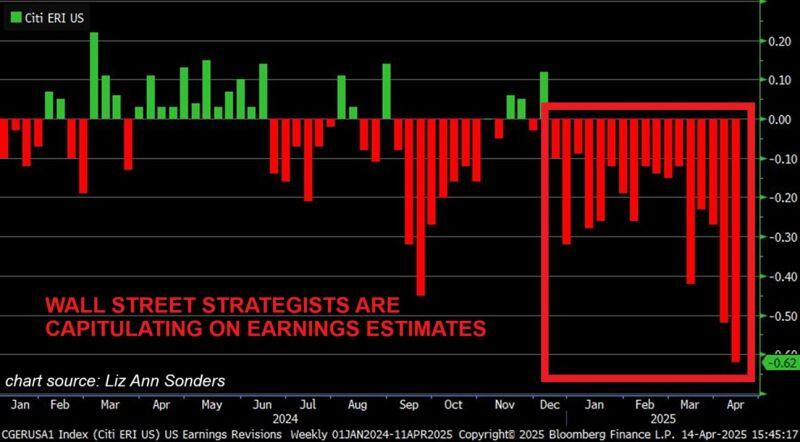
‼️Wall Street strategists are CAPITULATING on earnings estimates:
➡️ S&P 500 earnings have been revised DOWN for 17 consecutive weeks, the longest streak since the 2022 BEAR MARKET. ➡️The share of firms with higher less lower EPS revisions hit 48%, the highest since the 2020 CRISIS. Source: Global Markets Investor, Liz Ann Sonders, Bloomberg
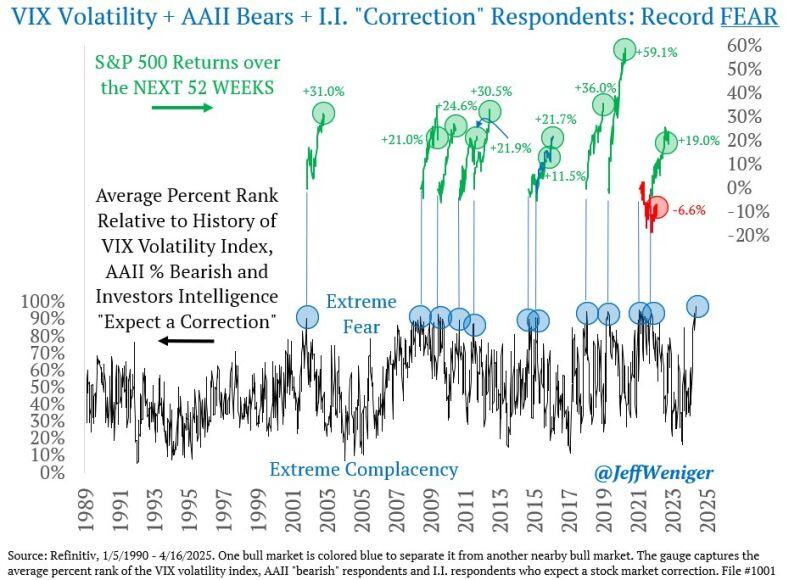
🔴 A very interesting chart by Jeff Weniger on X
You're looking at the highest reading on record in 1,841 weekly stock market sentiment observations from 1990 to 2025. ▶️ The inputs: the VIX volatility index + AAII survey bearish respondents + Investors Intelligence survey respondents who expect a correction. ▶️In 10 of the last 11 fear spikes, the S&P 500 went on to gains over the next 52 weeks. Returns were often large too (+31.0%, +21.0%, and so on)...
Interesting thread on X
China just launched a new kind of trade war. "The U.S. slapped tariffs on Chinese goods. China didn’t retaliate with weapons. They retaliated with information. The kind that makes $1,000 handbags look like $10 scams. TikTok is now flooded with Chinese suppliers exposing the truth: 👜 “You want a Birkin? We make them.” 🧘♀️ “Those $100 Lululemons? They’re $6 here.” 👟 “Your Nikes? Same factory.” Made in China. Shipped to Europe. Stamped “luxury.” Sent back. Marked up 1,000%. You thought you were buying European craftsmanship. You were buying a logo, a story, and a markup fantasy. China just ripped the mask off the entire Western luxury machine and showed you the receipts. And they’re being petty with it. 😏 They’re not just selling you knockoffs. They’re showing you the exact factory. Telling you the production cost. And teaching you how to fly in, shop direct, and skip tariffs altogether.
Investing with intelligence
Our latest research, commentary and market outlooks


