Straight from the Desk
Syz the moment
Live feeds, charts, breaking stories, all day long.
- All
- equities
- United States
- Macroeconomics
- Food for Thoughts
- markets
- Central banks
- Fixed Income
- bitcoin
- Asia
- europe
- investing
- geopolitics
- technical analysis
- gold
- Commodities
- Crypto
- AI
- Technology
- nvidia
- ETF
- earnings
- Forex
- china
- Real Estate
- oil
- banking
- Volatility
- energy
- magnificent-7
- apple
- Alternatives
- emerging-markets
- switzerland
- tesla
- United Kingdom
- Middle East
- assetmanagement
- amazon
- microsoft
- russia
- ethereum
- ESG
- meta
- Industrial-production
- bankruptcy
- Healthcare
- Turkey
- Global Markets Outlook
- africa
- Market Outlook
- brics
- performance
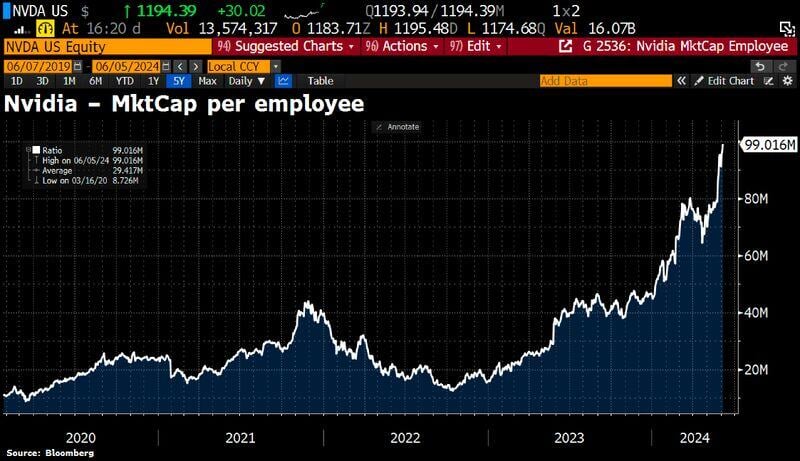
BREAKING: Nvidia stock, $NVDA, officially crosses above $1,200 for the first time in history.
Nvidia now has a market cap of $2.95 TRILLION and is just 3% away from passing Apple, $AAPL, as the largest public company in the world. To put things into perspective: the market cap per employee of Nvidia has hit almost $100,000,000. Source: Bloomberg, HolgerZ
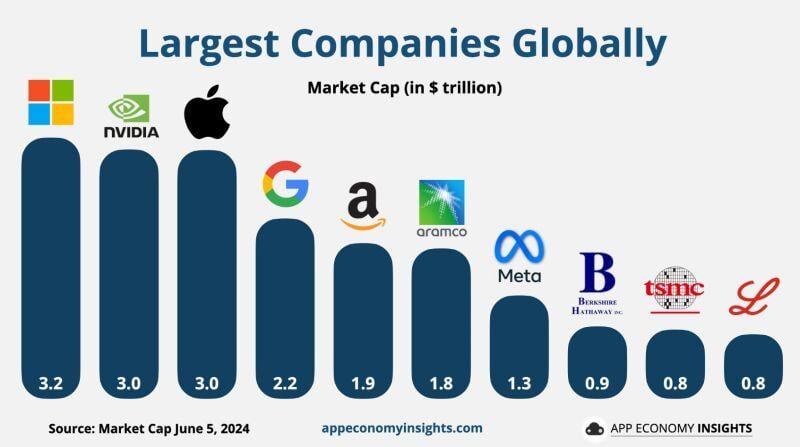
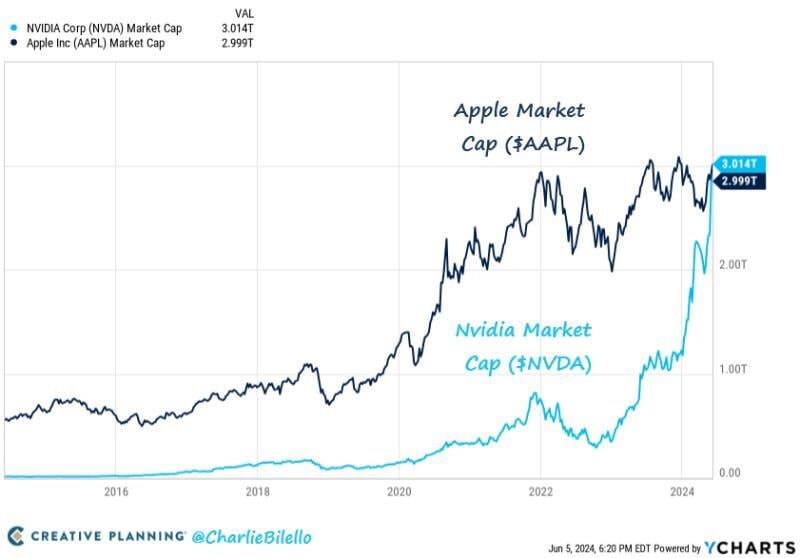
NVIDIA $NVDA reaches a $3T valuation and overtakes Apple $AAPL as the 2nd largest company globally.
Source: App Economy Insights
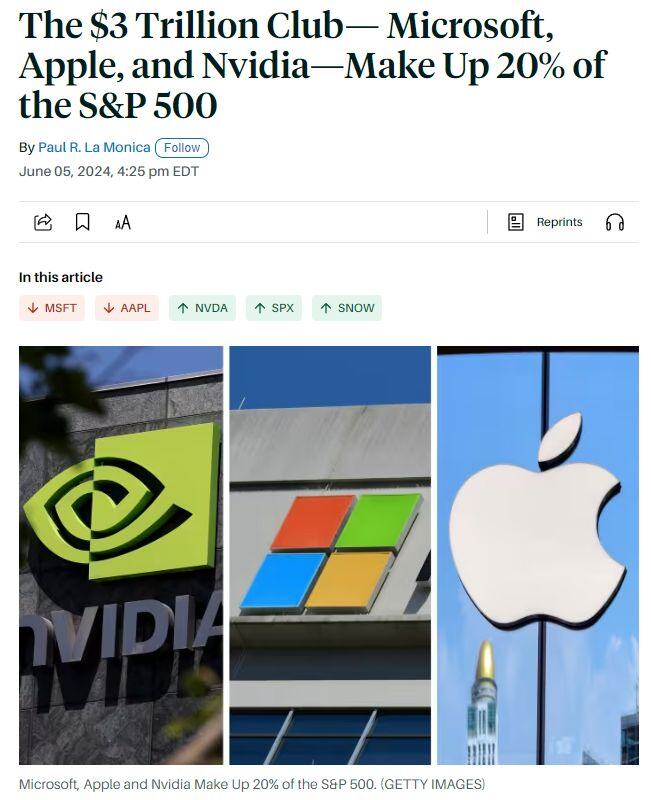
Just 3 stocks - Microsoft $MSFT, Nvidia $NVDA, and Apple $AAPL - now account for 20% of the S&P 500
Source: Barchart
Nvidia, $NVDA, was up another 6% yesterday (including after hours) moving to a record $1,237/share.
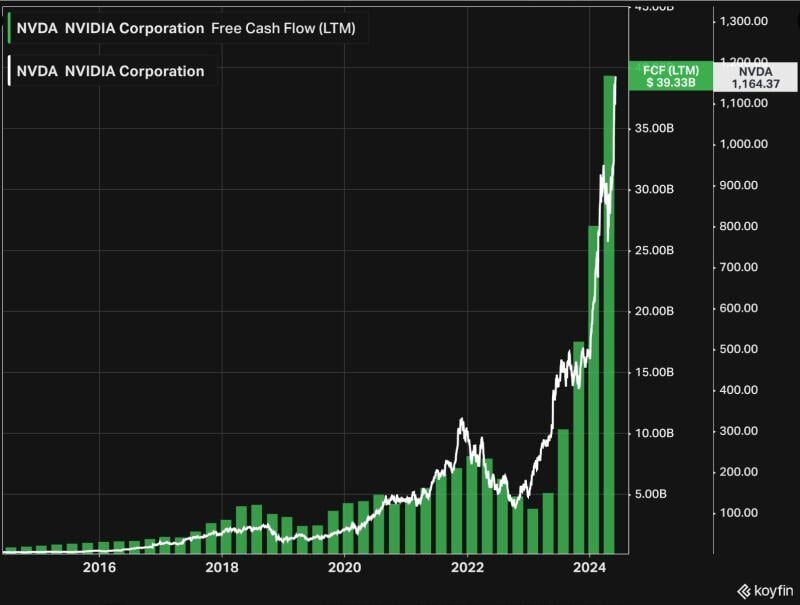
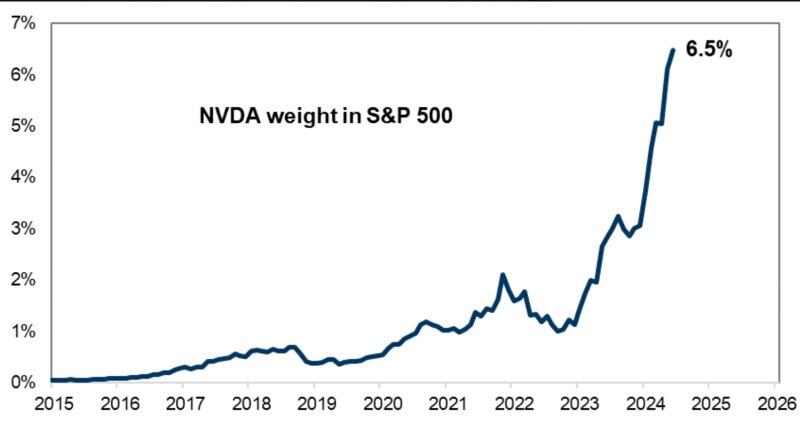
This puts the stock up 155% in 2024 ALONE, adding $1.83 TRILLION of market cap. To put this in perspective, Nvidia has now added as much market cap as the entire value of Amazon, $AMZN, in 6 months. 10 years ago Apple had a market cap 53x higher than hashtag#Nvidia. Today, Nvidia ended the day with a market cap of $3 trillion, surpassing Apple to become the 2nd largest company in the world. Note that Nvidia has also accounted for almost HALF of the S&P 500's YTD market cap gain... Source: Charlie Bilello. The Kobeissi Letter
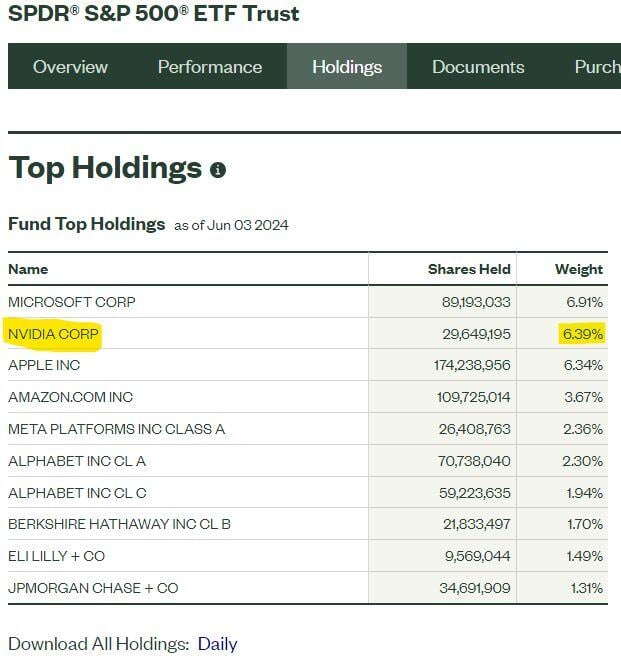
Nvidia $NVDA hit a new all-time high today of $1,166 and has passed Apple to become the 2nd largest holding in the S&P 500.
$SPY $NVDA $AAPL Source: Charlie Bilello
Tech CEOs are the new modern day rockstars $NVDA
Source: Trendspider
Investing with intelligence
Our latest research, commentary and market outlooks


