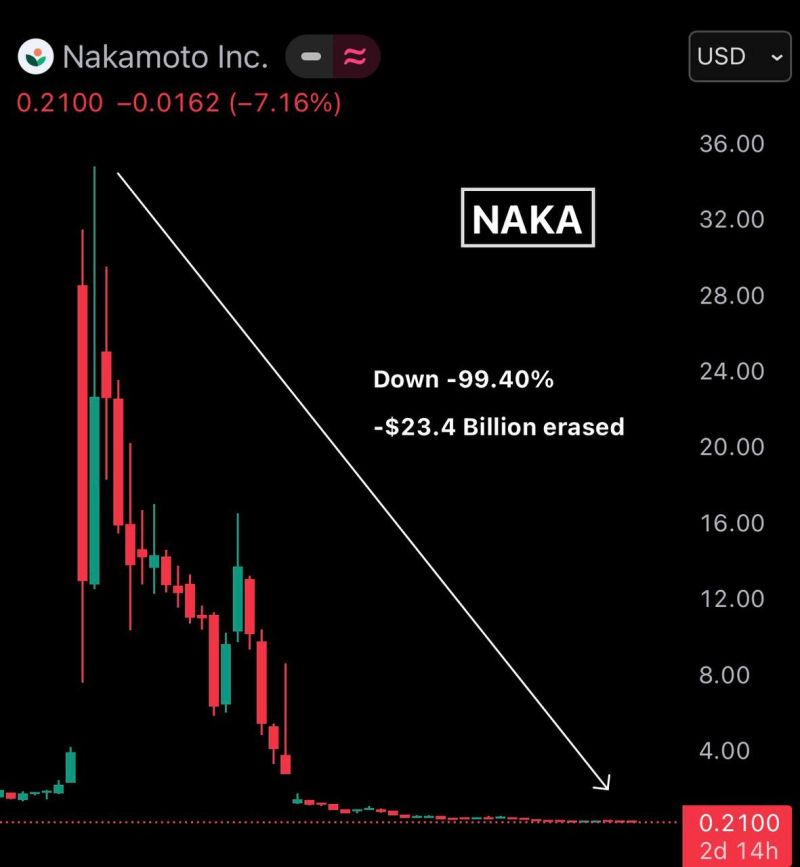
If you invested $1,000,000 in this company a year ago, Today you would have nearly $6,000.
A Bitcoin treasury company Nakamoto $NAKA crashed -99.30% in less than a year from its peak market cap of $24 billion to just $180 million erasing $23.3B in value. They company came under fire after the filing revealed that they just sold $20M worth of BTC at $70K which they bought at an average buying price of $118K, booking a -40% loss. The core issue is simple. Bitcoin is trading far below their cost basis, so the value of their treasury is shrinking while liabilities remain fixed. At the same time, the stock has collapsed below $1 for 30+ consecutive days, which directly triggers Nasdaq non compliance. If this is not fixed, the stock is expected to be delisted by 8 June 2026. Once delisted: liquidity drops → institutional access reduces → raising capital becomes extremely difficult. Source: Bull Theory
Kind of mind-boggling.
Source: Lance Roberts @LanceRoberts
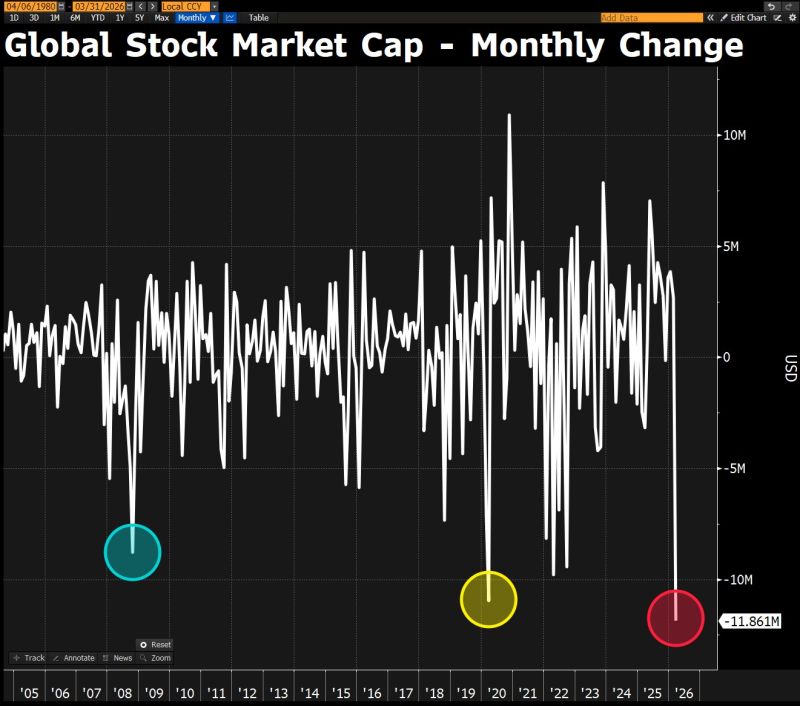
Global stocks lost $12 trillion in March, the single-largest value wipeout on record in a single month
(≠ to worst month on record; that's still Oct 2008, just that now the market is much much bigger) Source: Bloomberg, David Ingles @DavidInglesTV
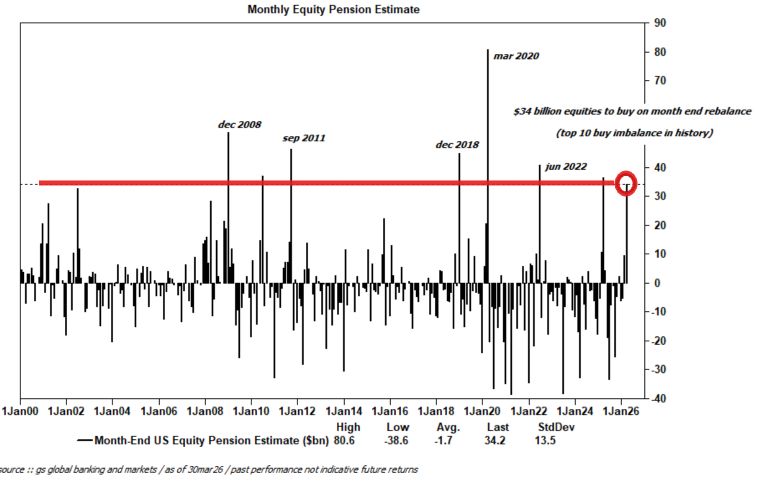
In considering Tuesday's rally, don't forget that the quarter-end pension rebalance was estimated by Goldman at $34bn, the 8th largest since 2000 and a top 10 buy imbalance in history.
$34bn to buy in equities ranks in the 94th percentile amongst all buy and sell estimates in absolute dollar value over the past three years and in the 96th percentile going back to Jan 2000. Source: Neil Sethi on X, Goldman Sachs
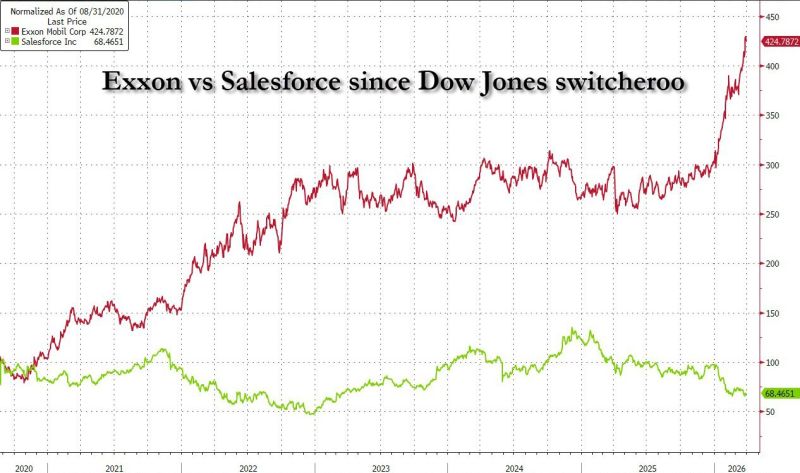
Since Exxon was kicked out of the Dow Jones "Industrial" Average and replaced by Salesforce in August 2020, Exxon is up 325%. Salesforce is down 32%
Source: zerohedge
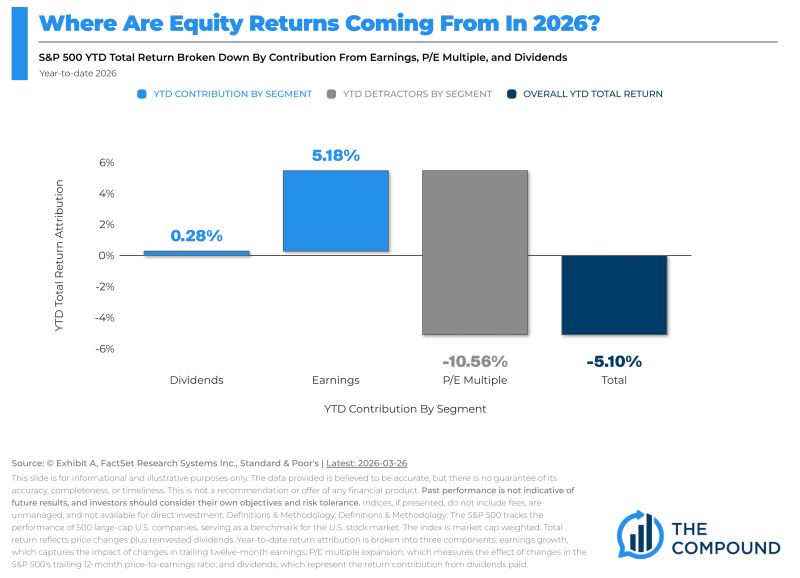
Strong earnings with multiple contraction. That’s 2026 in a nutshell.
Source: @mattcerminaro Daily Chartbook
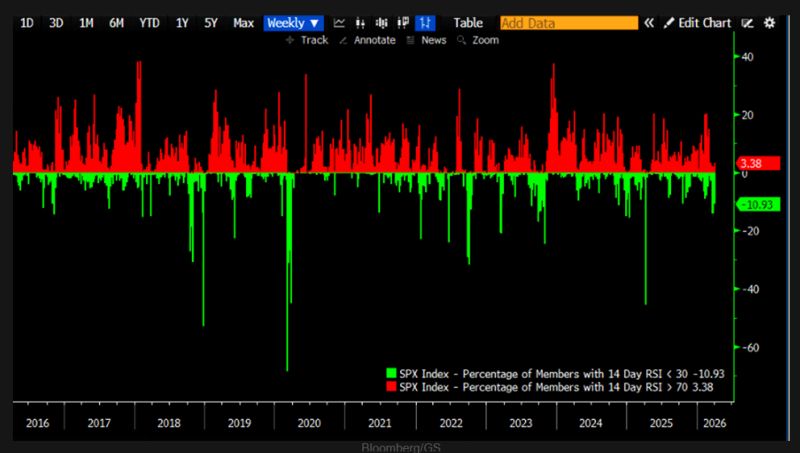
Could we see more pain?
Yes, on the surface, the S&P 500 looks nearly oversold, but underneath, the situation looks different with only 11% of SPX constituents being oversold. Source: TME, Bloomberg, GS
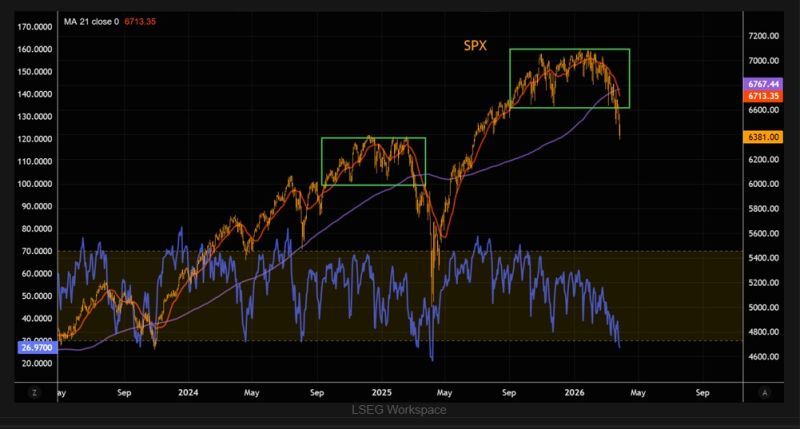
The sp500 technical picture remains pretty much the same: not pretty
We’re now well below the 200-day, with the 21-day crossing below it, a “light” death cross. RSI is at its most oversold levels since the Liberation Day panic, so a bounce is possible. But beware of the "catching a falling knife" strategy - very often a risky one. Source: TME, LSEG Workspace