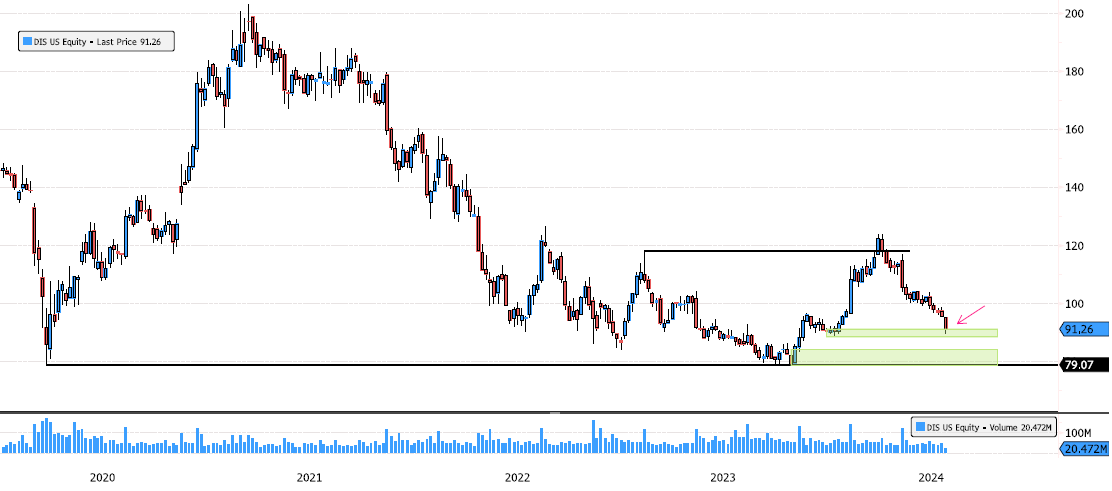
Walt Disney Reaching 1st Support Zone
Walt Disney (DIS US) has consolidated 61% since March 2021 and recently confirmed a change in the bearish trend! The stock is back at very important levels. The 1st support zone at 88-91 is critical to watch, and if it breaks, the next level to keep an eye on is between 78.73 and 84. Source: Bloomberg
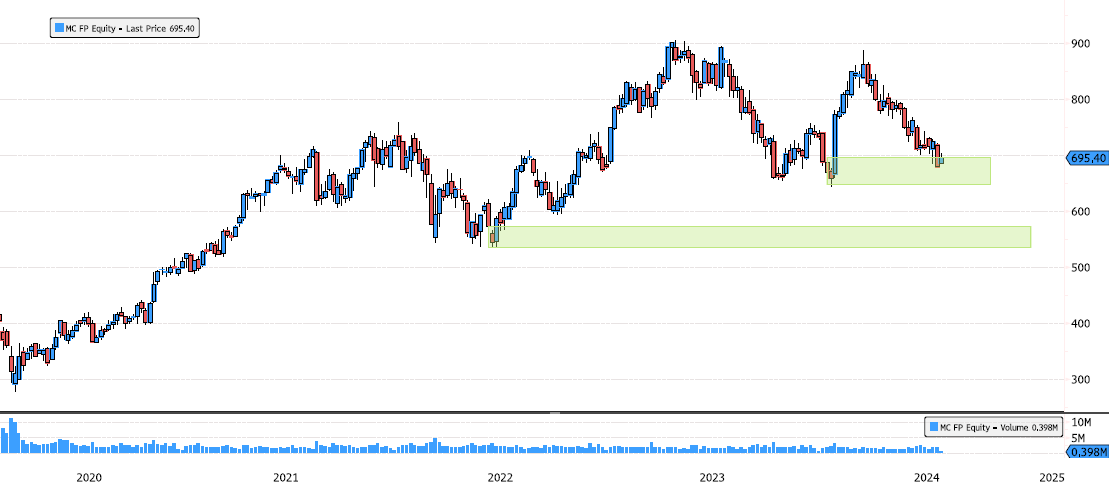
LVMH Seems to Respect Support Zone
LVMH (MC FP) hasn't moved much on earnings today. The stock is still within the support zone of 647-695. This isn't a major swing support, so be careful. A rebound can happen, but the market may still test the last major swing support between 535-573. Source : Bloomberg
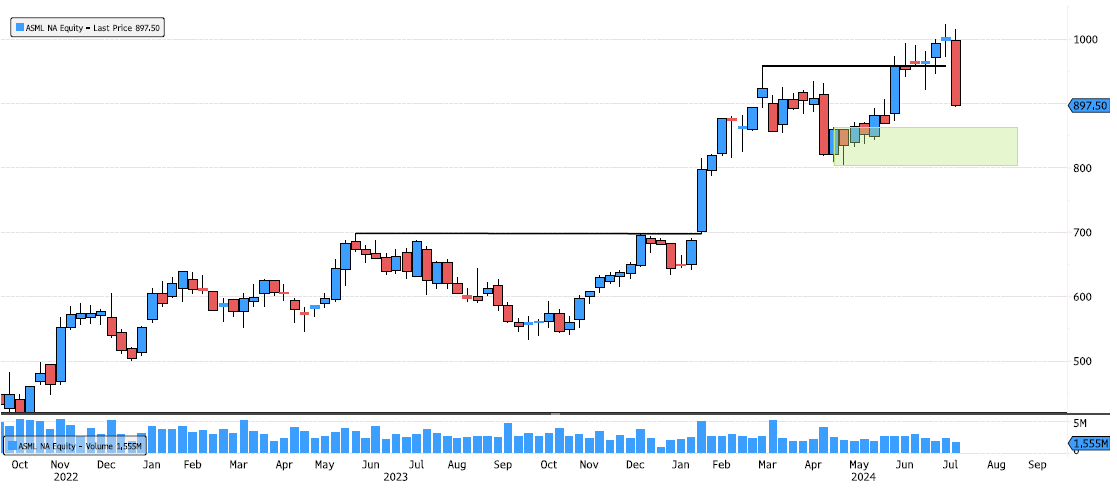
ASML Trying to Find Support
ASML is under pressure today, down 8% due to earnings. The next major support zone to keep an eye on is between 804-862. Source: Bloomberg
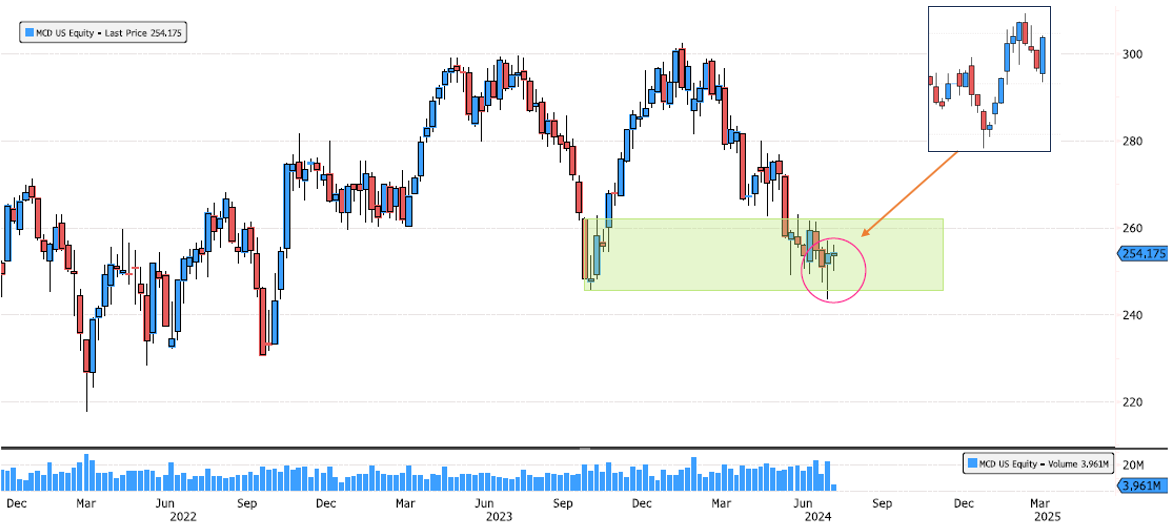
McDonald's Showing Bullish Momentum on Short Term
McDonald's (MCD US) has been in a support zone for 9 weeks! Last week, there was a false breakout below 245, but it managed to close above. On the short-term chart, there is growing bullish momentum. Keep an eye on it. Source: Bloomberg
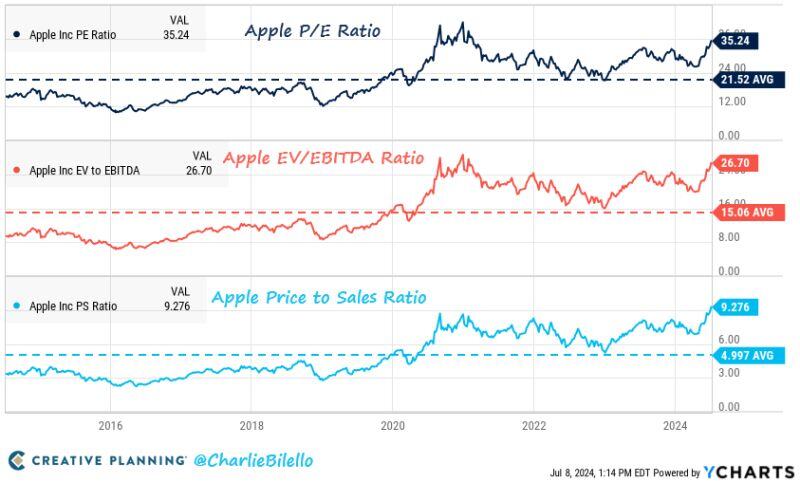
Apple's P/E Ratio: 35x
10-year average: 22x Apple's EV/EBITDA Ratio: 27x 10-year average: 15x Apple's Price to Sales Ratio: 9.3x 10-year average: 5.0x $AAPL Source: Charlie Bilello
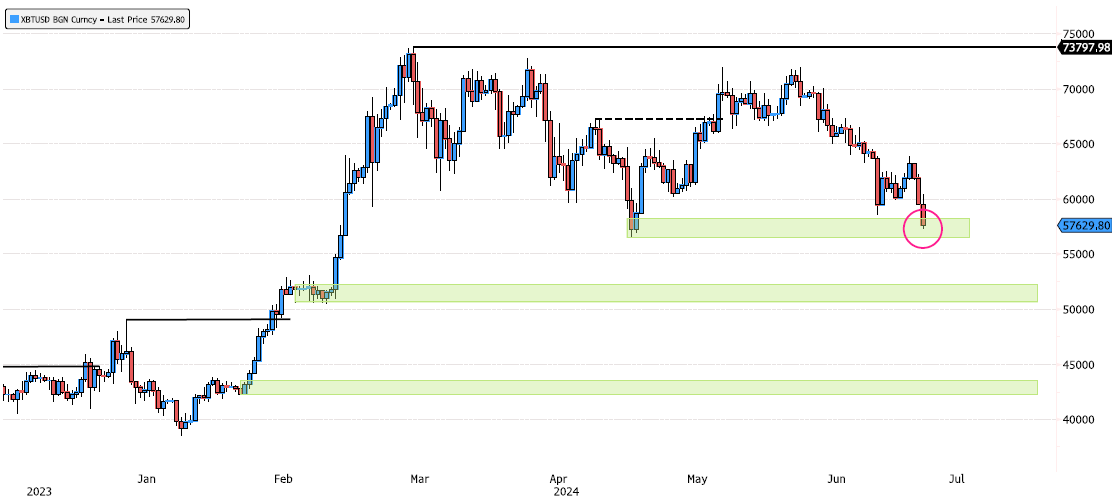
Bitcoin at Major Support Zone
Bitcoin (XBTUSD) is now testing the major support zone between 56,500-58,000. This zone is critical because if it breaks, the consolidation that started in March could become more complex and volatile. It would open the door for a test of the next support level at 50,700-52,250 or even the 45,000 levels. But for the time being, keep an eye out for a rebound at this level. Source: Bloomberg
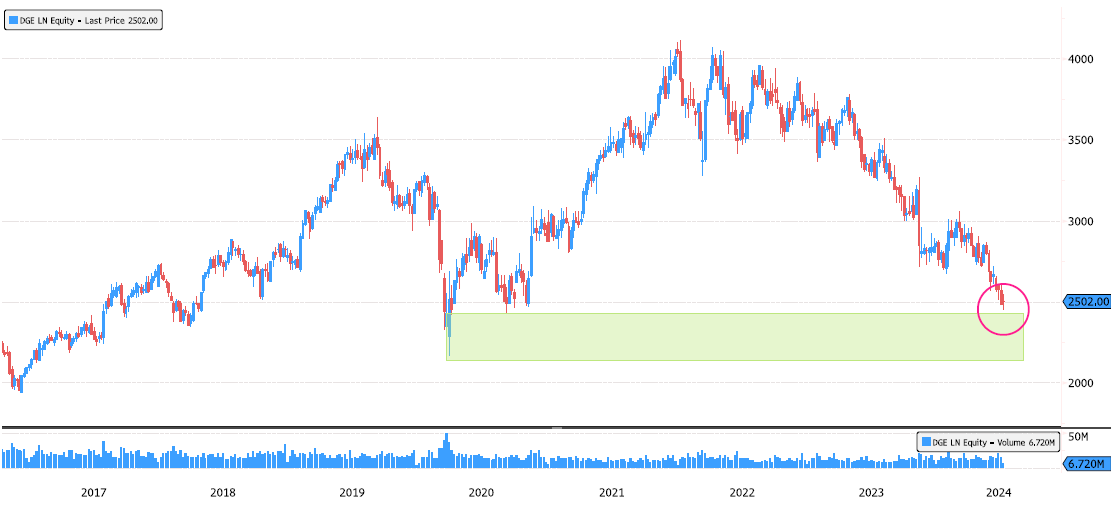
Diageo Reaching Major Support Zone
Diageo (DGE LN) is down 40% since January 2022! The long-term trend remains bullish. The stock is now reaching the 2020 major support zone between 2139-2427. Keep an eye on this level. Source: Bloomberg
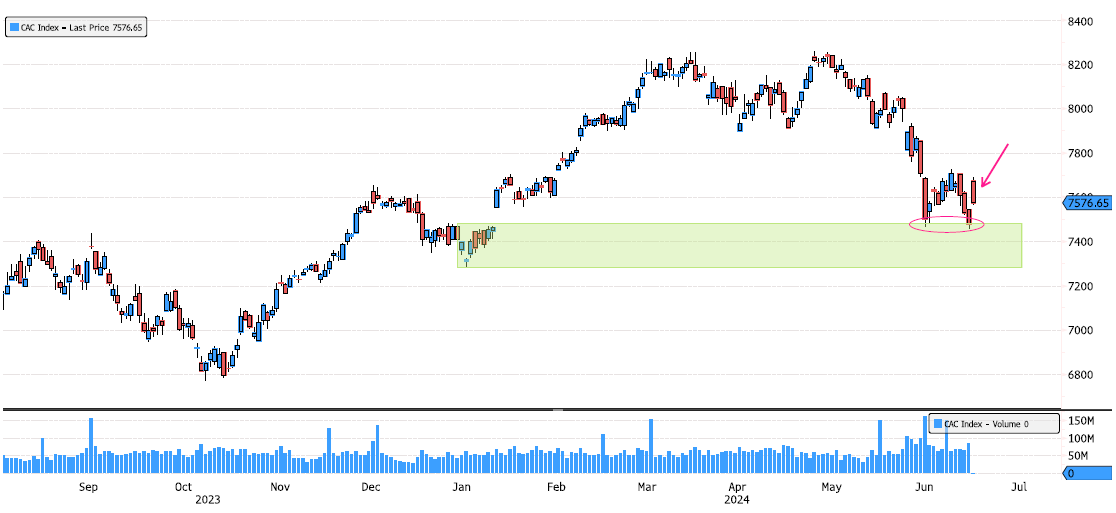
CAC 40 Index Rebounds on Major Support
The CAC 40 Index rebounded on the major support zone between 7285-7480 after posting a double bottom. It’s still a bit early to say that the consolidation is over, so keep an eye out for a close above 7725. Source: Bloomberg