US sets stage for antitrust probes into Microsoft, OpenAI and Nvidia
Source: Reuters
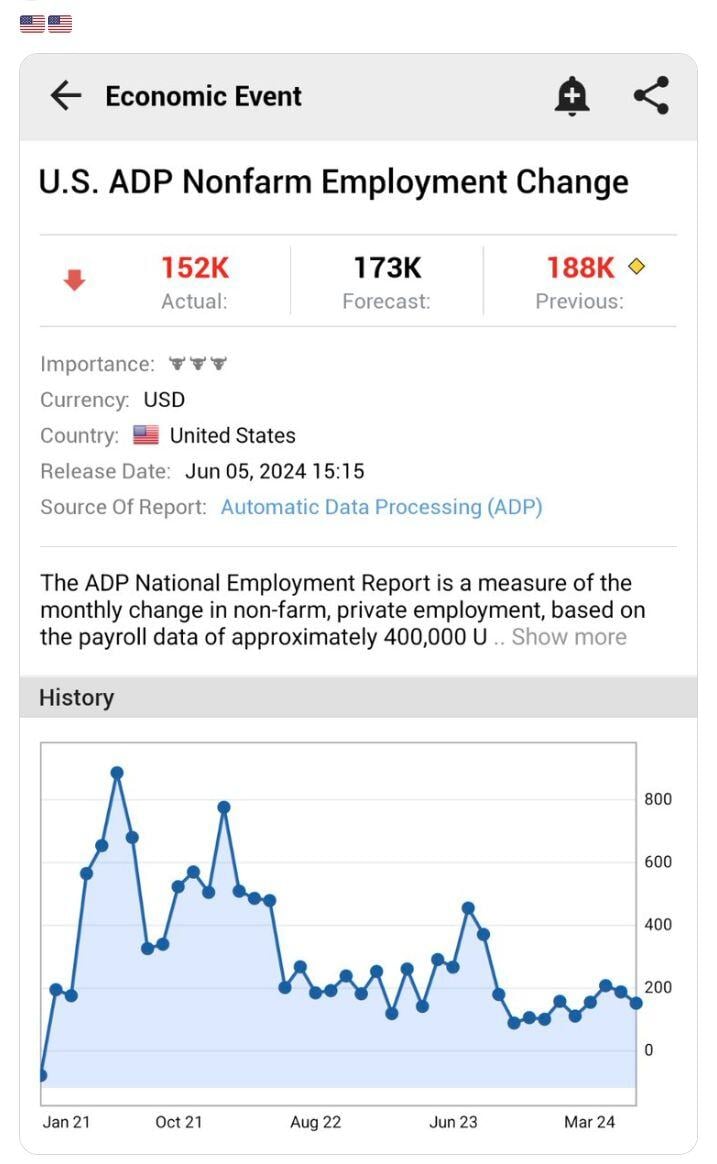
*U.S. MAY ADP NONFARM PAYROLLS REPORT*
1. The U.S. economy added a lower-than-expected 152,000 jobs in May, as per ADP, missing forecasts for a gain of 173,000 (previous was 188,000). 2. This is the lowest number since February 3. The number of job gains for April was revised down from +192,000 to show a gain of +188,000. Key Takeaway: The weak ADP report adds to evidence of a slowing labour market. September rate cut bets will grow stronger as cracks begin to emerge in the economy. Source: www.investing.com
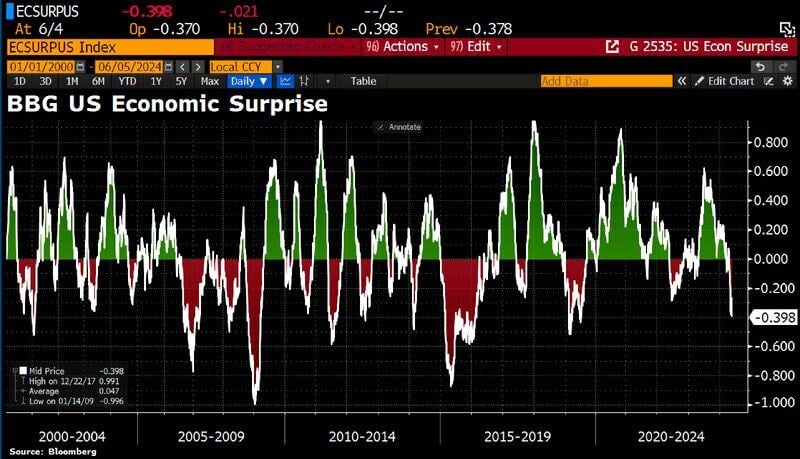
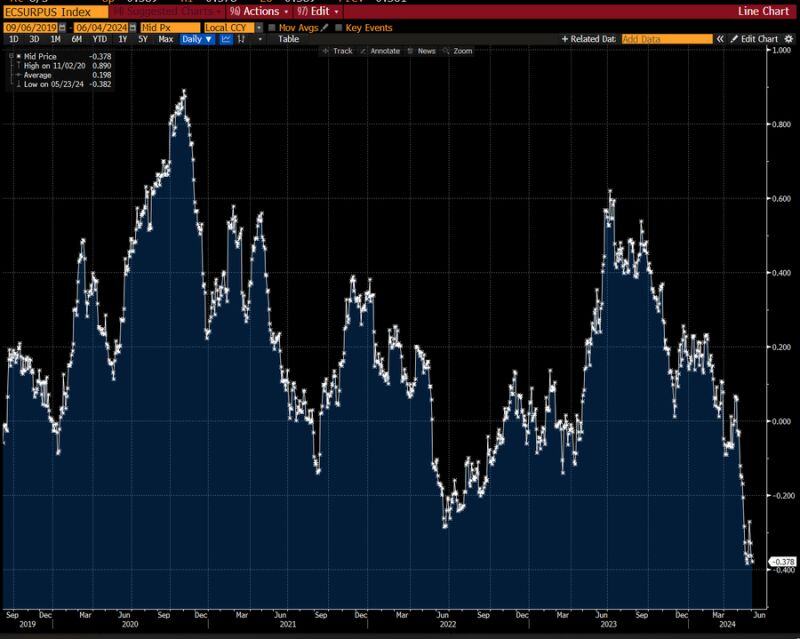
As economic data continues to underwhelm (ISM Manufacturing, JOLTs), the BBG US economic surprise index has plunged to its lowest level in 5 years.
Source: Bloomberg, HolgerZ
The US could be on the brink of the civil war according to Ray Dalio
In an interview given to the FT on 16 May, billionaire investor and founder of Bridgewater Associates warns about the risk of a civil war breaking in the US. Source: FT
The Bloomberg US Economic Surprise index is about the most negative since 2019.
DB's Jim Reid: Yesterday's ISM manufacturing report "was definitely one that dampened optimism about the state of the US economy right now. And it follows a run of weaker US data over recent days." Source: Bloomberg, Liza Abramowitz
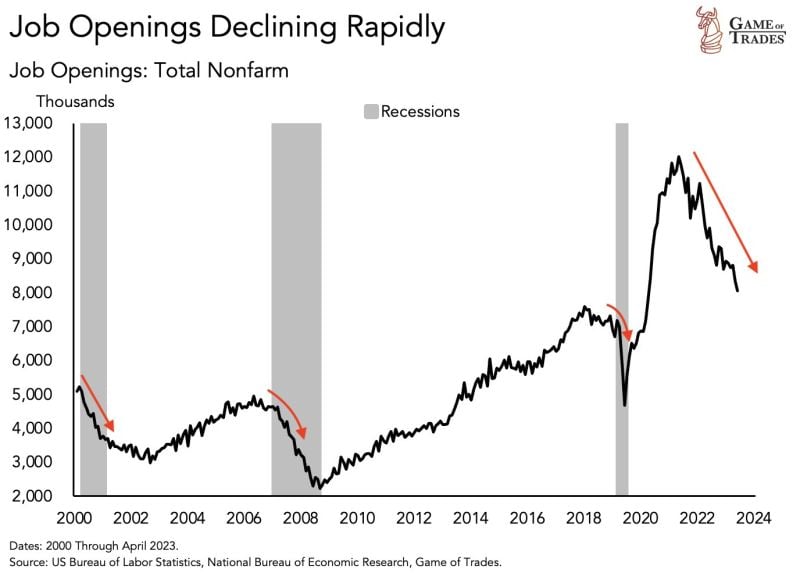
US job openings have just seen a sharp move down today.
JOLTS 8.06 million openings vs 8.4 million expectations. This is rather a large miss. This kind of a steep declining has only been seen 3 times since 2000. The jobs market continues to soften. Source: Game of Trades
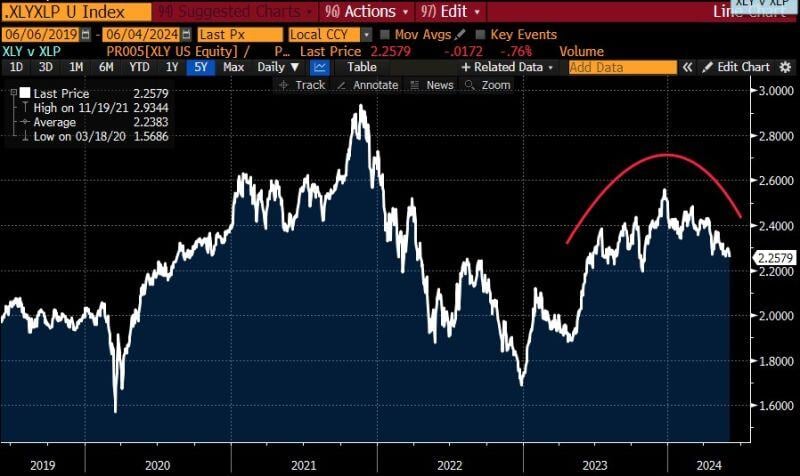
Is US Consumer Discretionary vs Staples giving us a warning sign about the US consumer?
Source: Bloomberg
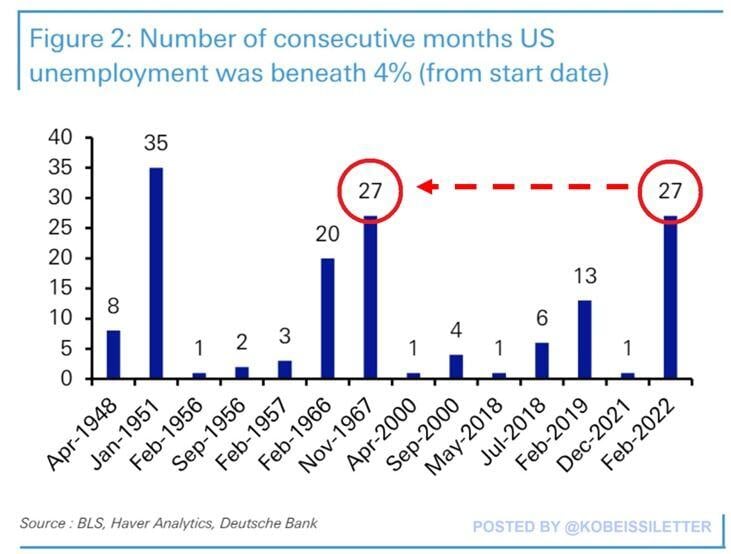
How "strong" is the labor market?
The US economy has seen an unemployment rate below 4% for 27 straight months, longest streak since the 1967. The longest streak of below 4% unemployment occurred in 1951 and lasted for 35 months. On Friday, the BLS will release labor market data for May, and estimates believe unemployment will be 3.9%. If unemployment comes in line or below expectations, it would mark the 2nd longest streak in history. Meanwhile, most Americans argue that the economy is getting worse. All eyes are on labor market data on Friday. Source: The Kobeissi Letter, DB