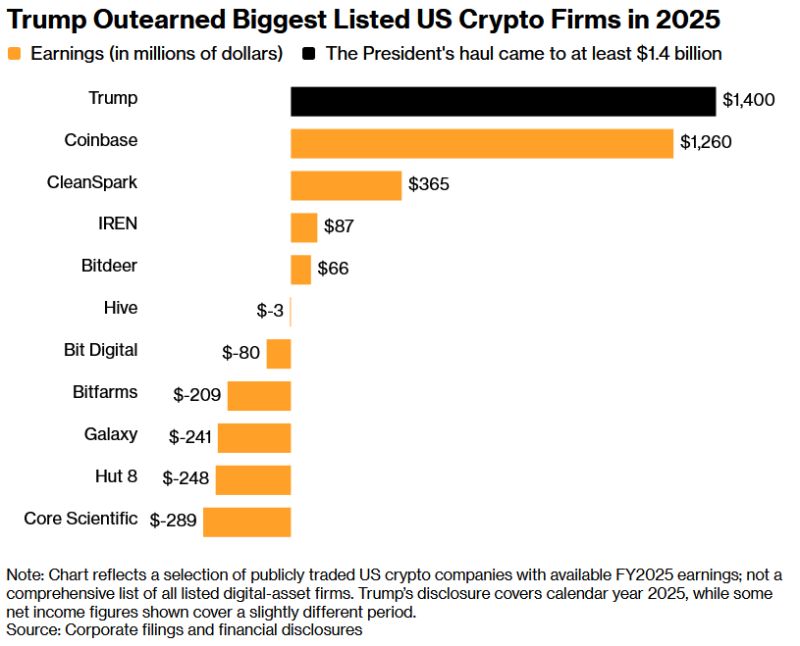
Trump personally made more from crypto than EVERY publicly traded US crypto company.
Pro-crypto president indeed... Source: Nic @puckrin
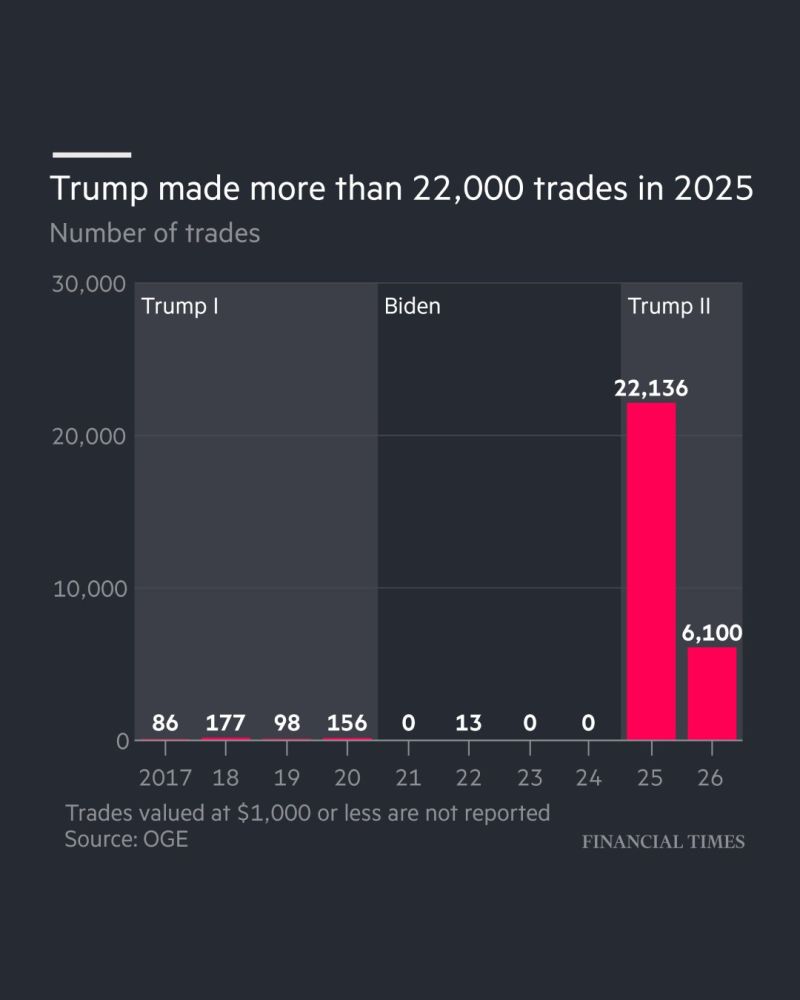
Donald Trump declared making more than 22,000 stock transactions in 2025, according to the FT analysis.
His immediate predecessor, Joe Biden, made 13 transactions over four years. In his first term, Trump made 517. Source: FT
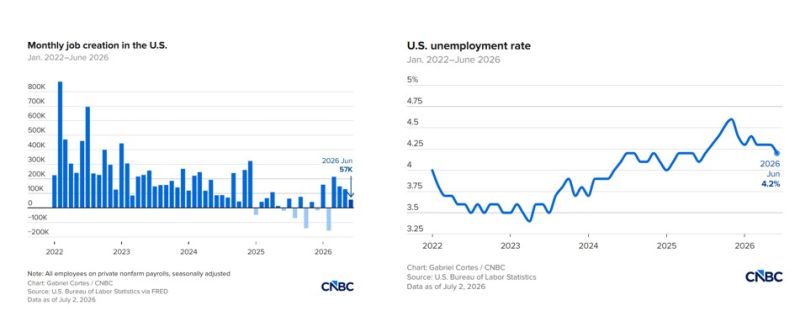
The U.S. labor market just sent its weakest signal in months.
June payrolls rose by only 57,000, well below expectations of 115,000 and down sharply from May's revised 129,000. At first glance, the unemployment rate improved to 4.2%. But the headline masks growing weakness. The labor force participation rate fell to 61.5%, its lowest level since March 2021, while household employment plunged by 507,000 people in a single month. Wage growth remained resilient, with average hourly earnings rising 0.3% month-over-month and 3.5% year-over-year, suggesting inflationary pressures have not fully disappeared. Under the surface, the picture is mixed: 📈 Professional & business services: +36K 📈 Social assistance: +25K 📈 Healthcare: +22K 📈 Government: +8K But leisure & hospitality LOST 61,000 jobs 🚨, despite expectations that the World Cup would boost seasonal hiring. The labor market is no longer collapsing. But it is clearly cooling. For the Fed, this report strengthens the case that growth is slowing, even if wage pressures remain sticky. Source: CNBC
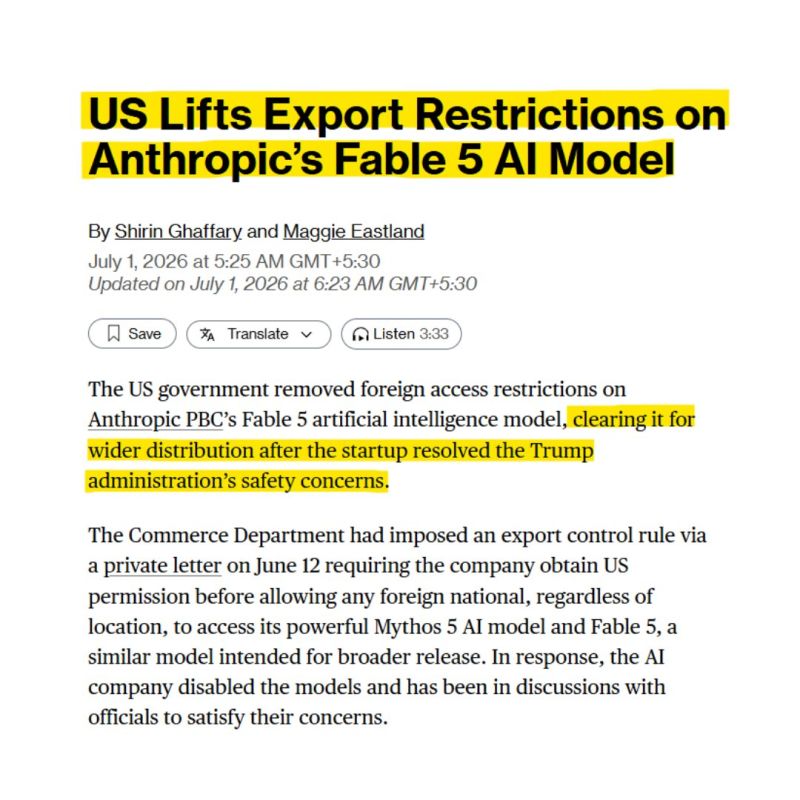
BREAKING: The US government has lifted export restrictions on Anthropic's Fable 5 and Mythos 5 AI models.
The restrictions, imposed on June 12 over national security concerns, have now been fully removed after Anthropic agreed to strengthen safeguards and coordinate with the US government on AI security. Anthropic said it expects to restore user access starting Wednesday. Source: Bull Theory
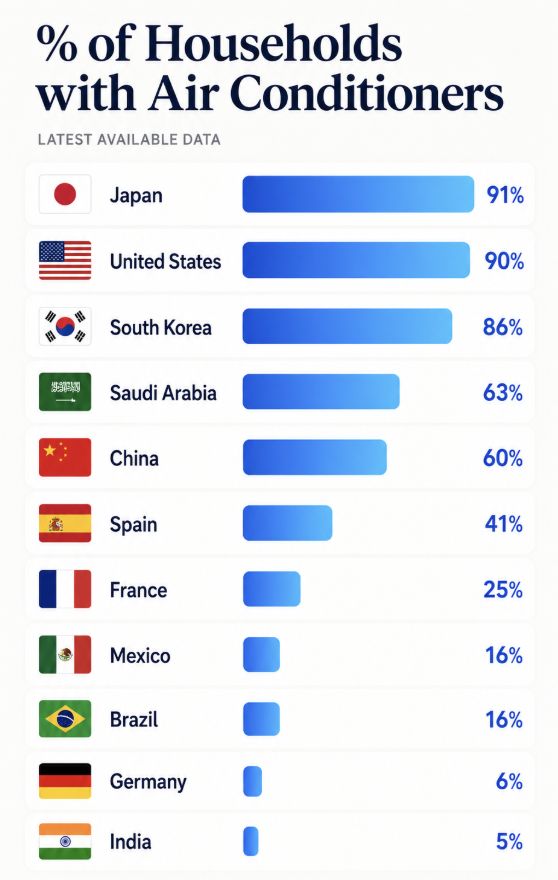
About AC in Europe...
Source. Rand
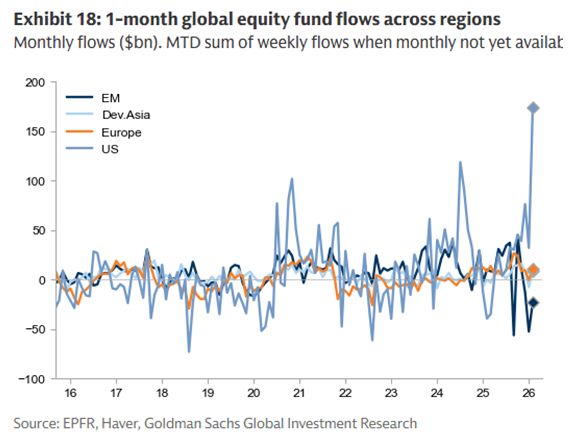
The US equity market is recording massive inflows
Source: EPFR, Goldman
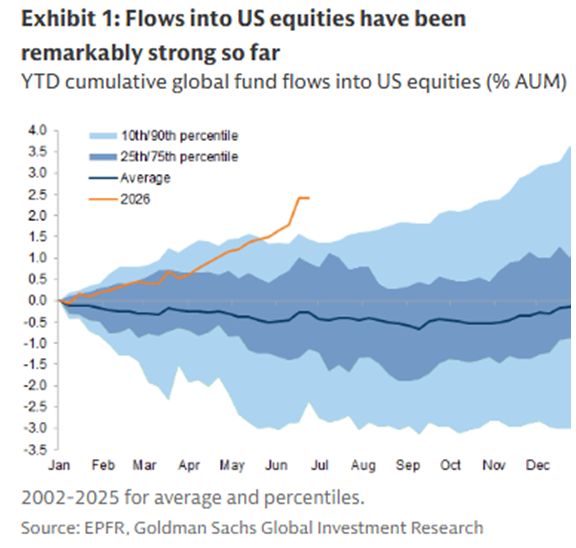
The end of US exceptionalism? really?
Source: Goldman, EPFR
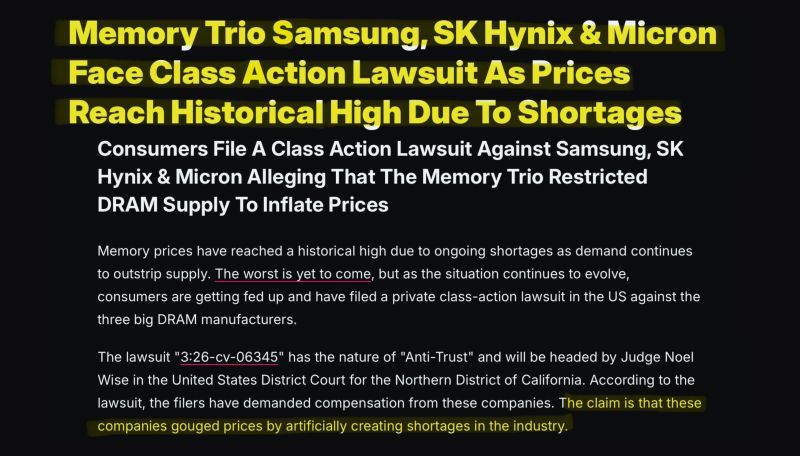
In case you missed it...Samsung Electronics, SK Hynix, and Micron Technology were sued on June 25 in federal court over allegations of collusion and price-fixing in the commodity memory market.
Filed in the Northern District of California, the complaint names 17 plaintiffs — a mix of individuals and small businesses — who claim the three chipmakers conspired to keep commodity DRAM artificially scarce in order to inflate prices, according to Wccftech Source. Yahoo Finance