Straight from the Desk
Syz the moment
Live feeds, charts, breaking stories, all day long.
- All
- equities
- United States
- Macroeconomics
- Food for Thoughts
- markets
- Central banks
- Fixed Income
- bitcoin
- Asia
- europe
- investing
- geopolitics
- gold
- technical analysis
- Commodities
- Crypto
- AI
- Technology
- nvidia
- ETF
- earnings
- Forex
- china
- Real Estate
- oil
- banking
- Volatility
- energy
- magnificent-7
- apple
- Alternatives
- emerging-markets
- switzerland
- tesla
- United Kingdom
- Middle East
- assetmanagement
- amazon
- microsoft
- russia
- ethereum
- ESG
- meta
- Industrial-production
- bankruptcy
- Healthcare
- Turkey
- Global Markets Outlook
- africa
- Market Outlook
- brics
- performance
Selling scarcity as illustrated by Quartr.
Visualizing the insane retail vs. resale price contrast of Patek Philippe's limited Tiffany (a part of LVMH) blue-colored timepiece. "You never actually own a Patek Philippe. You merely look after it for the next generation."
BREAKING >>>> Kamala Harris starts the race down 9 Points, even worse than Biden
A national survey released yesterday (22/7) by HarrisX and Forbes Breaking News shows former President Donald J. Trump more than doubling his lead over both President Joe Biden and Vice President Kamala Harris in the aftermath of the Republican National Convention (RNC). The poll, taken before Biden officially dropped out of the race, indicates Trump leading Biden among registered voters 48%-40%, up from 45%-42% prior to RNC, and leading Harris 50% to 41%. Among likely November voters, Trump’s lead increases to double digits: 49%-39% against Biden, with 12% undecided and 51%-40% against Harris, with 9% as undecided voters. The poll, which was conducted July 19-21, 2024 with 2,753 registered voters, also shows that voters expect Trump to win in November. Nearly two in three (65%) expected him to win against Biden and nearly as many (63%) say he would win against Harris. “Kamala Harris starts her 2024 battle behind Trump, who is enjoying a strong post-convention bump and leads her by almost digits in our polling,” commented Dritan Nesho, CEO and chief pollster at HarrisX, on the findings. “If the polls don’t start to close and show better traction for her, Biden’s decision to step aside for Harris may be a case of ‘too similar, too late.’ That said, Vice President Harris alleviates concerns among the democratic base and is better able to sway undecided independents and suburban women, showing some promise.” Source: HarrisX/Forbes
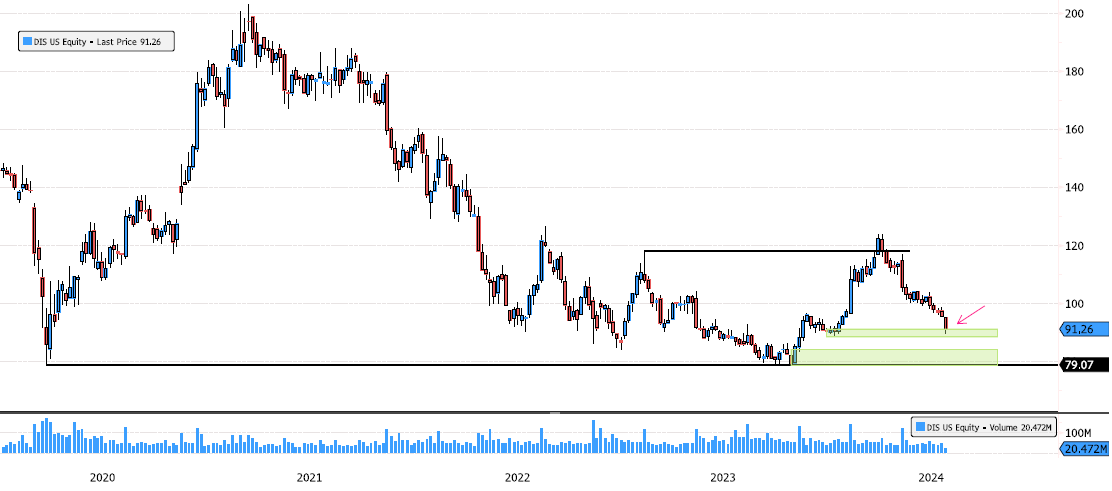
Walt Disney Reaching 1st Support Zone
Walt Disney (DIS US) has consolidated 61% since March 2021 and recently confirmed a change in the bearish trend! The stock is back at very important levels. The 1st support zone at 88-91 is critical to watch, and if it breaks, the next level to keep an eye on is between 78.73 and 84. Source: Bloomberg
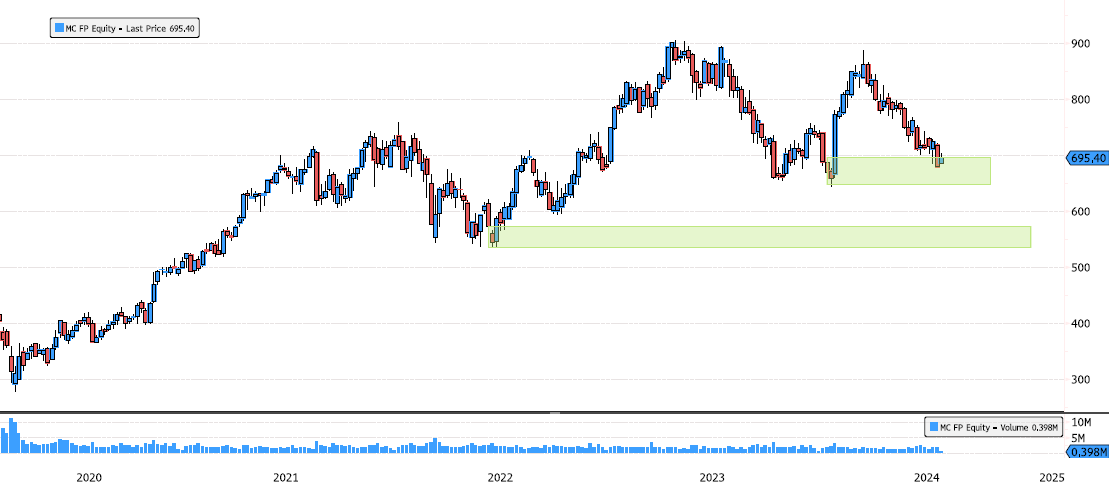
LVMH Seems to Respect Support Zone
LVMH (MC FP) hasn't moved much on earnings today. The stock is still within the support zone of 647-695. This isn't a major swing support, so be careful. A rebound can happen, but the market may still test the last major swing support between 535-573. Source : Bloomberg
Will the Presidential race be a tighter one than currently predicted?
Watch out
Investing with intelligence
Our latest research, commentary and market outlooks


